Correlation Analysis: How to Make Sense of Correlation Metrics|2025
/in SPSS Articles /by BesttutorCorrelation analysis is a statistical method used to assess the strength and direction of the relationship between two or more variables. In research, this analysis is crucial for identifying trends and relationships within data, helping researchers draw inferences and make predictions. While correlation metrics are widely used across disciplines, it is essential to understand both their utility and limitations in order to interpret results accurately. This paper will explore the concept of correlation analysis, provide examples from various research fields, delve into its formulas, and discuss its limitations, particularly in the realms of statistics and psychology.

Table of Contents
ToggleUnderstanding Correlation Analysis
Correlation analysis helps to quantify the degree to which two variables are related. This relationship can either be positive, negative, or non-existent. A positive correlation means that as one variable increases, the other tends to increase as well. Conversely, a negative correlation indicates that as one variable increases, the other tends to decrease. A correlation of zero suggests no relationship between the variables.
The most commonly used correlation coefficient is Pearson’s r, which ranges from -1 to +1. A Pearson correlation of +1 indicates a perfect positive correlation, while -1 indicates a perfect negative correlation. A value of 0 indicates no linear relationship. Other types of correlation coefficients include Spearman’s rank correlation (used for ordinal variables) and Kendall’s tau (used for ranked data).
Correlation Analysis in Research Methodology
In research methodology, correlation analysis plays a vital role in understanding how variables interact and whether they exhibit any dependency. It is particularly useful in the early stages of research to identify potential relationships between variables. For instance, a researcher may use correlation analysis to determine if there is a relationship between two variables, such as the number of hours spent studying and exam scores. The researcher can then use this information to further explore or test the hypothesis through other methods, such as regression analysis.
When conducting correlation analysis in research, it is important to remember that correlation does not imply causation. Just because two variables are correlated does not mean one causes the other. Researchers must be cautious in drawing conclusions based solely on correlation results.
Correlation Analysis in Research Example
For example, in medical research, a study may examine the correlation between smoking and lung cancer. A correlation analysis may show a strong positive correlation, suggesting that individuals who smoke are more likely to develop lung cancer. However, it is essential to remember that correlation does not necessarily indicate causality, and other factors, such as genetics or environmental influences, may contribute to the development of lung cancer.
How to Conduct Correlation Analysis in Research
Conducting correlation analysis in research involves several key steps:
- Collect Data: The first step in performing correlation analysis is to gather relevant data on the variables you wish to analyze. The data should be continuous (interval or ratio level) for Pearson’s r, though other types of correlation can be used for different data types.
- Check Assumptions: Correlation analysis assumes that the relationship between the variables is linear, that the data is continuous, and that there is homoscedasticity (the variability of one variable is consistent across the range of another variable).
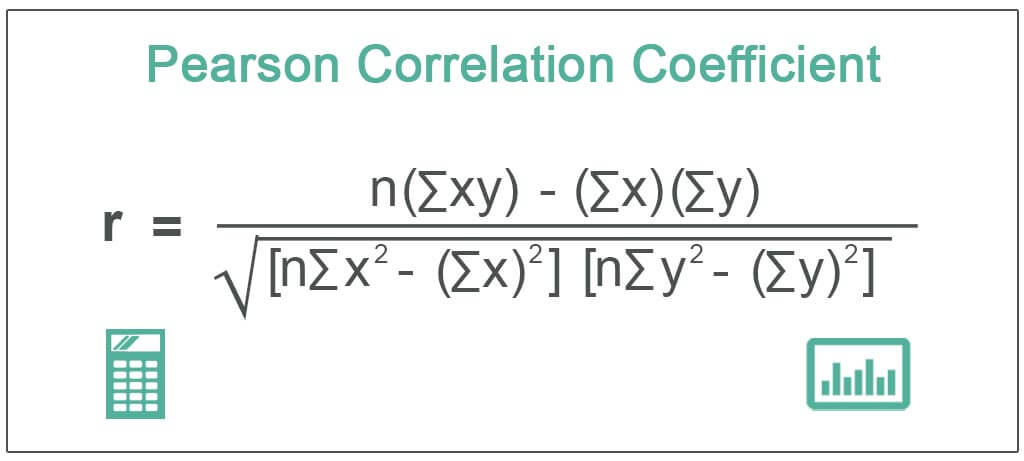
- Calculate the Correlation Coefficient: Use the appropriate formula to calculate the correlation coefficient. For Pearson’s r, the formula is:r=n∑XY−(∑X)(∑Y)[n∑X2−(∑X)2][n∑Y2−(∑Y)2]r = \frac{n\sum{XY} – (\sum{X})(\sum{Y})}{\sqrt{[n\sum{X^2} – (\sum{X})^2][n\sum{Y^2} – (\sum{Y})^2]}}r=[n∑X2−(∑X)2][n∑Y2−(∑Y)2]n∑XY−(∑X)(∑Y)Where:
- XXX and YYY are the two variables being correlated,
- nnn is the number of data points,
- ∑\sum∑ denotes summation.
- Interpret the Results: After calculating the correlation coefficient, interpret the result based on its value. A coefficient close to +1 or -1 suggests a strong relationship, while a coefficient close to 0 suggests a weak or no linear relationship.
- Draw Conclusions: Based on the results of the correlation analysis, researchers can decide whether further analysis is needed. If a significant relationship is found, more complex methods like regression analysis may be appropriate to explore the nature of the relationship further.
Correlation Analysis in Research Formula
The formula for Pearson’s correlation coefficient is vital for calculating the relationship between two continuous variables. The above formula outlines the process of calculating Pearson’s r. However, there are also other correlation formulas used in research, such as Spearman’s rank correlation (for ordinal data) and Kendall’s tau (used for smaller datasets or when ties exist in data).
For Spearman’s rank correlation, the formula is:
ρ=1−6∑d2n(n2−1)\rho = 1 – \frac{6\sum{d^2}}{n(n^2 – 1)}ρ=1−n(n2−1)6∑d2Where:
- ddd is the difference in ranks between the paired observations,
- nnn is the number of data points.
This formula is used when the data is not normally distributed or when the relationship between the variables is not linear. Kendall’s tau uses a similar formula but focuses on the number of concordant and discordant pairs in the data.
Limitations of Correlation Analysis
While correlation analysis is a powerful tool, it has several limitations that researchers must consider:
Correlation Does Not Imply Causation
One of the most significant limitations of correlation analysis is that it cannot establish cause-and-effect relationships between variables. Just because two variables are correlated does not mean that one causes the other. This is especially true in observational studies, where researchers cannot control for confounding factors. For example, while a strong correlation between ice cream sales and drowning incidents may exist, this does not mean that buying ice cream causes drowning. A confounding variable, such as hot weather, may explain both phenomena.
Linear Relationship Assumption
Correlation analysis assumes that the relationship between variables is linear. If the relationship is non-linear, the correlation coefficient may underestimate the strength of the relationship. Researchers must check for non-linearity before relying on correlation coefficients.
Outliers
Outliers can significantly distort correlation results. A single outlier can inflate or deflate the correlation coefficient, leading to misleading conclusions. Researchers should always check for outliers and consider removing or correcting them when performing correlation analysis.
Limited to Two Variables
Traditional correlation analysis, such as Pearson’s r, examines only the relationship between two variables. While it can provide valuable insights into how two variables are related, it does not account for more complex interactions involving multiple variables. For more complex relationships, researchers may need to turn to multiple regression analysis or other multivariate techniques.
Limitations of Correlation in Statistics
In statistics, the primary limitation of correlation is its inability to determine causality. While correlation can identify a relationship between variables, it cannot explain the direction or mechanism of that relationship. Additionally, correlation may be affected by confounding variables, which can lead to spurious relationships that are not actually meaningful.
Another limitation is that correlation metrics typically assume a normal distribution of data. In cases where the data is skewed or not normally distributed, correlation analysis may not be appropriate, and non-parametric methods such as Spearman’s rank correlation should be used.

Limits of Correlation in Psychology
In psychology, the limitations of correlation are particularly pronounced because human behavior is often influenced by many complex, interrelated factors. Psychological studies frequently deal with variables that are difficult to measure precisely, and these variables may not exhibit a linear relationship.
Additionally, psychological research often involves non-experimental designs, meaning that correlation findings cannot be generalized to broader populations or interpreted causally. For example, a study may find a strong correlation between stress levels and anxiety, but this does not necessarily mean that stress causes anxiety. Other factors, such as personality traits or coping mechanisms, may play a role.
Finally, psychological data often involves measurement error, and correlations can be distorted by inaccuracies in data collection. Researchers must be cautious when interpreting correlations in psychological studies and take into account the complexity of human behavior.
Conclusion
Correlation analysis is an essential tool in research methodology, providing insights into the relationships between variables. However, researchers must understand the limitations of correlation metrics, particularly in their inability to infer causality. In statistics, the assumption of linear relationships and sensitivity to outliers can distort results, while in psychology, the complexity of human behavior makes interpreting correlations more challenging. By recognizing these limitations and supplementing correlation analysis with other research methods, researchers can make more accurate and meaningful conclusions.
For further reading, researchers can consult resources such as the Limitations of Correlation Analysis PDF and the Correlation Analysis in Research Methodology PDF for in-depth guides and examples of how to conduct and interpret correlation analysis in various fields.
Needs help with similar assignment?
We are available 24x7 to deliver the best services and assignment ready within 3-4 hours? Order a custom-written, plagiarism-free paper
