Creating Professional Reports in SPSS|2025
Creating Professional Reports in SPSS can be challenging without the right tools and techniques. Learn how to streamline your reporting process and present statistical findings with clarity and precision.
Introduction
Statistical Package for the Social Sciences (SPSS) is widely used for statistical analysis across various domains, including academia, healthcare, social sciences, and business. While its analytical capabilities are robust, users often encounter challenges when tasked with creating professional and presentable reports directly from SPSS. This article examines the typical hurdles faced during report creation in SPSS and suggests practical solutions and best practices.
Importance of Professional Reporting in SPSS
Professional reports are essential in conveying the results of statistical analysis to stakeholders, clients, or academic audiences. These reports must be accurate, clearly structured, visually appealing, and easy to interpret. SPSS allows users to generate outputs such as tables, graphs, and descriptive statistics, but transforming these outputs into coherent reports that meet professional standards remains a complex task.
Features of SPSS Report Generation
SPSS includes features that support report creation:
- Output Viewer: Displays results of analyses
- Chart Builder: Creates custom visualizations
- Table Editor: Allows some formatting of output tables
- Export Options: Allows exporting to Word, Excel, PDF, and other formats
- Syntax Editor: Enables automation and customization of analysis and output
Despite these tools, the report creation process is often cumbersome and requires supplementary tools to achieve desired professionalism.
Common Challenges in Creating Reports in SPSS
4.1. Interface Limitations SPSS’s Output Viewer has limited flexibility in editing and formatting content. Aligning tables, adjusting font sizes, or modifying colors often require exporting to a word processor.
4.2. Customization Constraints Customization of charts and tables is minimal. For instance, editing axis titles, legends, or color schemes in graphs can be unintuitive and time-consuming.
4.3. Output Management and Formatting Issues The output generated is not always organized or user-friendly. Reports can become lengthy, with irrelevant outputs cluttering the view. Organizing output sections for different parts of the analysis is not straightforward.
4.4. Integration with Other Software While SPSS allows exporting to MS Word and Excel, formatting does not always transfer well. Users often need to reformat content manually, consuming valuable time.
4.5. Interpretation Difficulties Non-statistical stakeholders may find SPSS outputs difficult to interpret due to technical jargon or lack of explanation within tables and charts.
4.6. Data Visualization Limitations The visual appeal of SPSS-generated charts is limited compared to modern visualization tools. Creating publication-quality charts within SPSS alone is a challenge.
4.7. Handling Large Datasets Reports involving large datasets can overwhelm SPSS, causing lag or crashes. Output viewers may freeze or crash, complicating report compilation.
4.8. Exporting Challenges Exporting complex outputs with consistent formatting is a challenge. Images and tables often lose alignment, and pagination issues arise when printing or saving to PDF.
4.9. Version Compatibility Different versions of SPSS may have slight differences in output formatting, which can lead to inconsistencies when collaborating with others using different versions.
4.10. Learning Curve Beginners find it challenging to create structured and visually appealing reports. SPSS documentation lacks depth in guiding users on report creation.
Best Practices for Creating Professional Reports in SPSS
- Use SPSS syntax to automate repetitive analysis and organize outputs
- Suppress unnecessary output to reduce clutter
- Label variables and values clearly before analysis
- Apply consistent formatting within the Table Editor
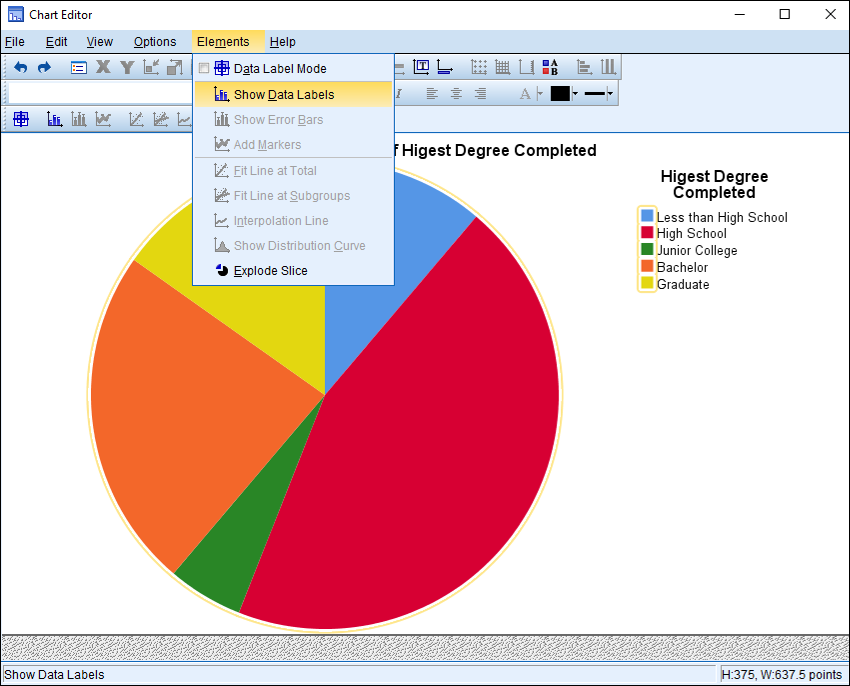
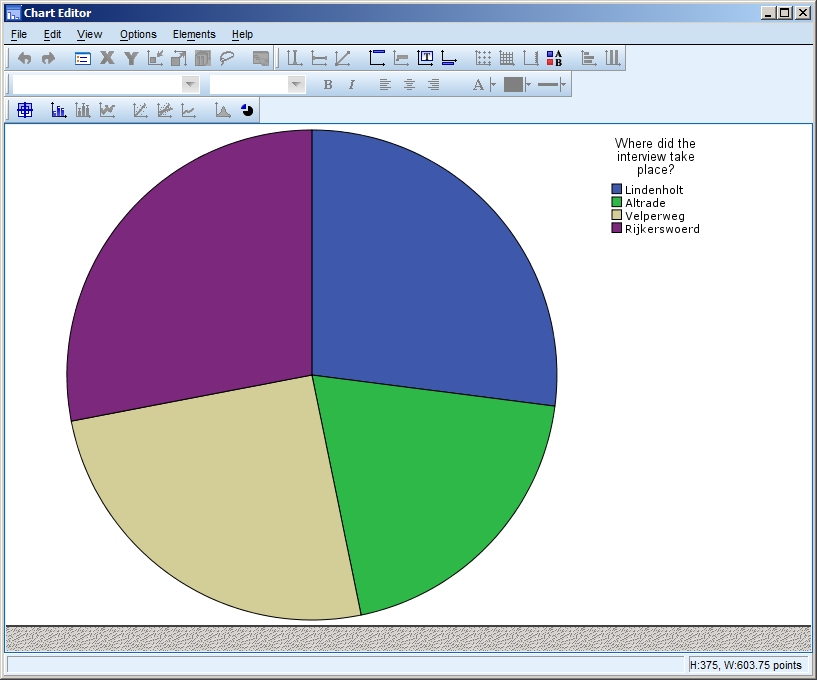
- Use Chart Editor to improve chart readability
- Export only the necessary output and compile reports in Word or PowerPoint
- Include narrative explanations alongside tables and charts
Enhancing Reports with External Tools
Professional-grade reports often require supplementing SPSS outputs with:
- Microsoft Word: For document formatting and textual explanations
- Excel: For refining tables or creating additional charts
- PowerPoint: For presenting reports to audiences
- Visualization tools: Such as Tableau or Power BI for better graphics
Using these tools, users can combine SPSS output with explanatory text, annotations, and custom visuals to enhance report professionalism.
Case Study Example
Scenario: A market research analyst needs to present customer satisfaction survey results.
Challenges:
- Raw SPSS output included numerous irrelevant statistics
- Charts were unappealing and difficult to interpret
- Report needed to be presented to non-technical stakeholders
Solutions:
- Analyst used syntax to limit output to relevant tests
- Exported tables to Word and reformatted with styles and captions
- Recreated graphs in Excel with clearer visuals
- Added commentary to explain findings in layman terms
Outcome:
- The final report was concise, visually engaging, and easy to interpret, meeting client expectations.

Conclusion
Creating professional reports in SPSS is often challenging due to interface limitations, formatting issues, and restricted customization. However, with structured approaches, use of syntax, and integration with external tools, users can overcome these challenges. Continuous learning and adopting best practices in report preparation are key to making SPSS reports not only statistically sound but also professionally presentable.
Needs help with similar assignment?
We are available 24x7 to deliver the best services and assignment ready within 3-4 hours? Order a custom-written, plagiarism-free paper
