Discriminant Analysis|2025
/in General Articles /by BesttutorDiscriminant analysis is a powerful statistical technique used to classify objects or observations into predefined categories based on a set of features or variables. This method is widely used in various fields of research, including biology, marketing, psychology, and law. The primary goal of discriminant analysis is to identify the variables that differentiate between two or more groups and to predict group membership for new observations. In this paper, we will delve into the details of discriminant analysis, including its objectives, formulas, applications, and interpretation. We will also explore its implementation using statistical software such as SPSS.
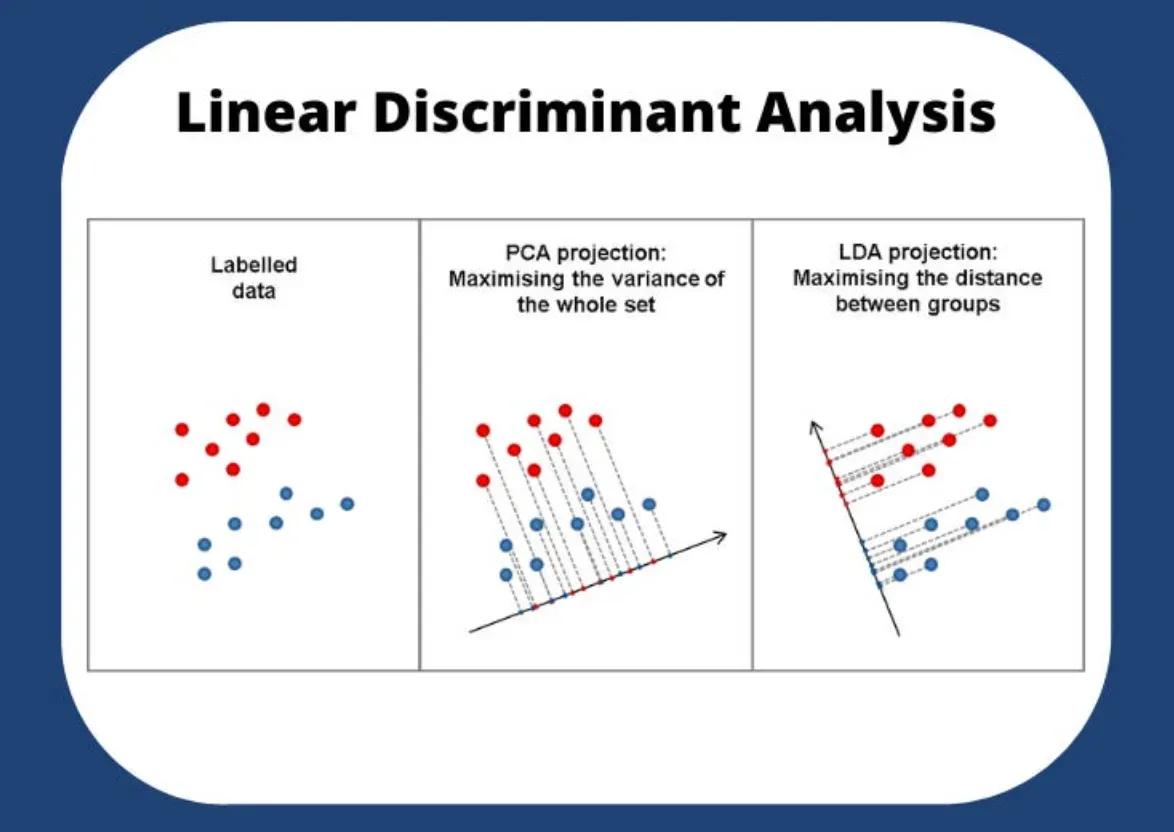
Table of Contents
ToggleIntroduction to Discriminant Analysis
Discriminant analysis is a statistical technique used to determine which variables discriminate between two or more groups. The goal is to find a combination of predictors that best distinguish between the categories or groups. There are two main types of discriminant analysis: Linear Discriminant Analysis (LDA) and Quadratic Discriminant Analysis (QDA). LDA assumes that the data for each group follow a normal distribution with the same covariance matrix, while QDA does not make this assumption and allows for different covariance matrices for each group.
In practice, discriminant analysis can be used to:
- Classify data into categories.
- Predict the group membership of new observations.
- Identify the variables that contribute most to group differences.
Discriminant analysis is commonly used in situations where the outcome or dependent variable is categorical. For example, in medical research, it might be used to classify patients as having a certain disease or not based on variables such as age, blood pressure, and cholesterol levels. In marketing, discriminant analysis can be used to segment customers into groups based on purchasing behavior.
Objectives of Discriminant Analysis
The primary objectives of discriminant analysis are as follows:
Classification
The main goal of discriminant analysis is classification. Given a set of predictor variables, the technique assigns new observations into predefined categories. This is achieved by finding the discriminant function, a linear combination of the predictor variables, that best separates the groups.
Identifying Key Variables
Discriminant analysis helps identify the variables that most effectively differentiate between groups. These variables can then be used in further research or decision-making processes. For instance, in medical research, identifying which factors are most significant in predicting disease outcomes is crucial for treatment strategies.
Predicting Group Membership
Once the discriminant function has been established, it can be used to predict the group membership of new observations. For example, a discriminant analysis model developed using historical data can be used to classify new customers into different market segments.
Validation
Discriminant analysis also involves validating the model to ensure that the group separation achieved is not due to random chance. This is done by assessing the accuracy of classification using techniques such as cross-validation, where the data is split into training and test sets.
The Discriminant Analysis Formula
Discriminant analysis uses a formula to create a discriminant function that separates the groups. For Linear Discriminant Analysis (LDA), the discriminant function is a linear combination of the predictor variables:
D(x)=∑i=1kwixi+bD(x) = \sum_{i=1}^{k} w_i x_i + bD(x)=i=1∑kwixi+bWhere:
- D(x)D(x)D(x) is the discriminant score for the observation xxx,
- wiw_iwi are the weights or coefficients of the predictor variables xix_ixi,
- bbb is the bias or constant term.
The weights wiw_iwi are estimated in such a way that the discriminant score maximizes the separation between the groups. The group with the highest discriminant score is predicted for a given observation.
In Quadratic Discriminant Analysis (QDA), the discriminant function includes quadratic terms (squared terms of the variables), and the covariance matrices for each group are assumed to be different.
Types of Discriminant Analysis
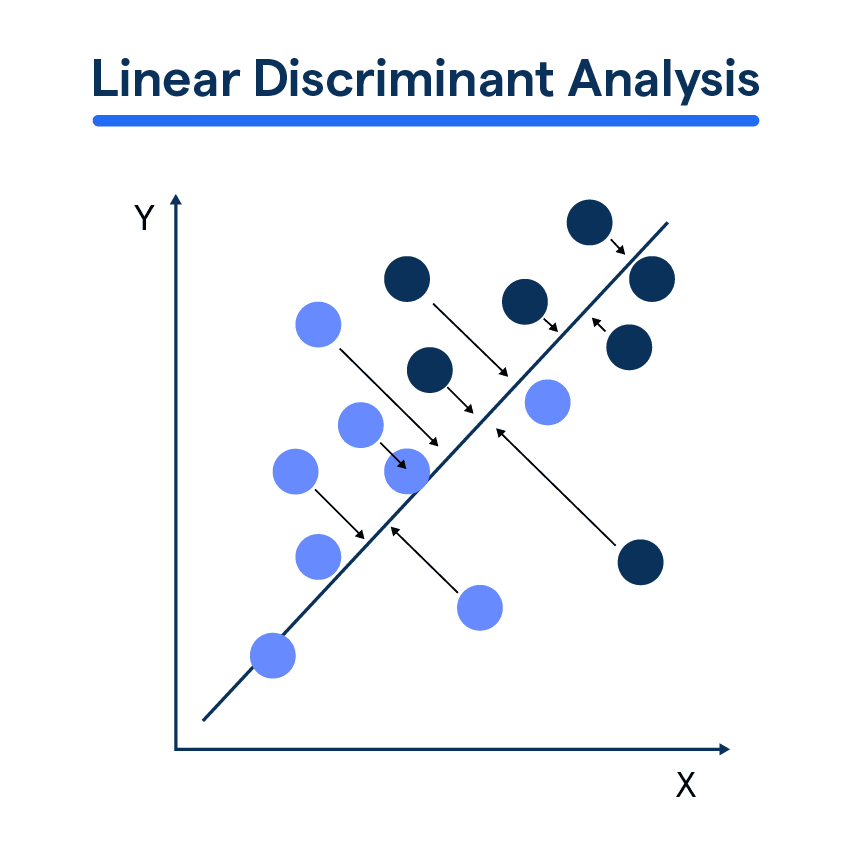
Linear Discriminant Analysis (LDA)
Linear Discriminant Analysis (LDA) is the most common form of discriminant analysis and assumes that the data from each group follow a Gaussian distribution with the same covariance matrix. LDA is particularly useful when the groups are linearly separable, meaning that a straight line can distinguish between the groups.
The basic steps in LDA include:
- Estimating the mean and covariance matrix for each group.
- Computing the within-group covariance matrix and between-group covariance matrix.
- Calculating the discriminant function based on the ratio of between-group variance to within-group variance.
LDA is widely used in fields such as finance for credit scoring, in medical diagnostics for classifying patients based on health indicators, and in marketing for customer segmentation.
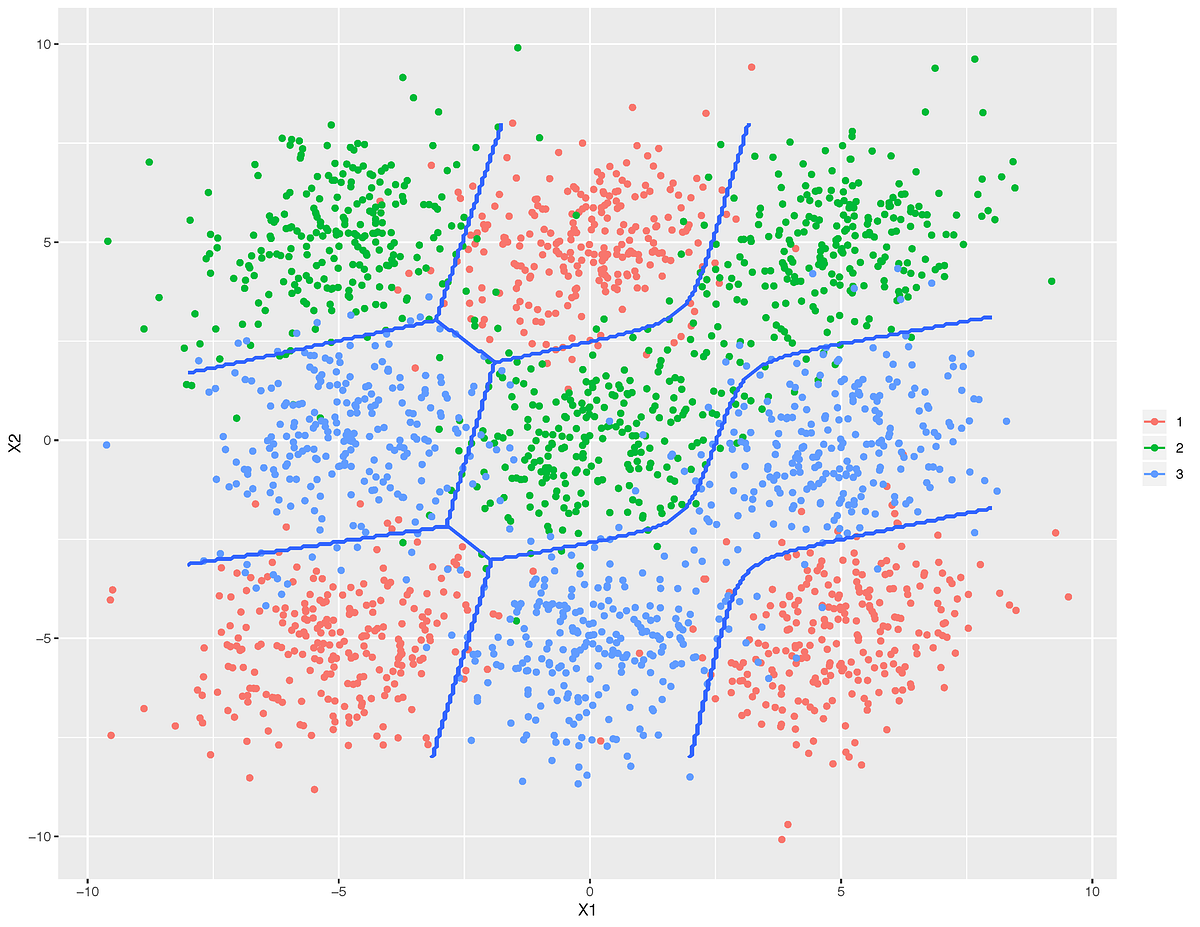
Quadratic Discriminant Analysis (QDA)
Quadratic Discriminant Analysis (QDA) is an extension of LDA that allows for a quadratic decision boundary between groups. Unlike LDA, QDA does not assume equal covariance matrices for each group. Instead, it estimates a separate covariance matrix for each group, which allows QDA to model more complex relationships between the predictor variables and group membership.
QDA is appropriate when the assumption of equal covariance matrices in LDA is not met. However, it requires more parameters to be estimated, which can lead to overfitting if the sample size is small.
Discriminant Analysis in Research
Discriminant analysis is widely used in research across various fields. In biological research, for example, LDA can be used to classify species based on measurements of their physical characteristics. In psychology, discriminant analysis can be used to predict personality traits or diagnose mental health conditions based on responses to questionnaires.
One common application in marketing research is market segmentation, where discriminant analysis helps businesses categorize their customers into distinct groups based on behaviors, demographics, or purchasing habits. In political science, it can be used to predict voting behavior based on socio-demographic factors.
Example: Discriminant Analysis in Marketing
Consider a company that wants to classify its customers into two groups: those who are likely to purchase a product and those who are not. The company collects data on customer attributes, such as age, income, and buying history. Discriminant analysis can be used to derive a function that classifies customers into these two groups. By analyzing the coefficients in the discriminant function, the company can also determine which customer characteristics are most strongly associated with purchasing behavior.
Discriminant Analysis Using SPSS
SPSS (Statistical Package for the Social Sciences) is one of the most popular statistical software packages for performing discriminant analysis. It provides an easy-to-use interface for conducting both LDA and QDA. The basic steps in performing discriminant analysis in SPSS are:
- Data Preparation: Ensure that the data is in the correct format, with the dependent variable as a categorical variable and the independent variables as continuous.
- Running the Analysis: In SPSS, discriminant analysis can be run by selecting “Analyze” → “Classify” → “Discriminant” from the menu. From here, you can select your dependent and independent variables.
- Model Evaluation: SPSS provides various output statistics, including the classification results, the discriminant function coefficients, and tests for equality of group means. These statistics help evaluate the effectiveness of the discriminant function.
- Interpreting the Results: SPSS outputs the classification matrix, which shows how well the model classifies the observations into the correct categories. The output also includes tests for the significance of the discriminant function and the overall classification accuracy.
Interpretation of Discriminant Analysis Results
Interpreting the results of a discriminant analysis involves understanding several key outputs. These include:
Classification Table
The classification table shows how well the model predicted group membership. Each row corresponds to an actual group, and each column corresponds to a predicted group. The diagonal elements represent the correct classifications, while off-diagonal elements indicate misclassifications.
Canonical Correlation
Canonical correlation is a measure of the strength of the relationship between the discriminant scores and the group membership. A higher canonical correlation indicates that the discriminant function does a better job of separating the groups.
Eigenvalues
Eigenvalues indicate the amount of variance explained by each discriminant function. Larger eigenvalues indicate more separation between the groups.
Wilks’ Lambda
Wilks’ Lambda is a test statistic used to assess the significance of the discriminant function. A lower value of Wilks’ Lambda suggests a better discriminating power of the function.
Coefficients of the Discriminant Function
The coefficients of the discriminant function indicate the importance of each predictor variable in separating the groups. A larger coefficient for a variable indicates that it has a stronger influence on the classification.
Conclusion
Discriminant analysis is a versatile and widely used technique for classifying observations into predefined categories based on predictor variables. By using discriminant functions, researchers can not only predict group membership for new observations but also identify the key variables that differentiate the groups. The technique has applications in various fields, including marketing, medicine, and psychology.
When performing discriminant analysis, it is essential to choose the appropriate method (LDA or QDA) and carefully interpret the results to ensure that the model is valid and useful for classification purposes. Statistical software such as SPSS provides an accessible platform for conducting discriminant analysis and generating insights from the data.
In summary, discriminant analysis is a valuable tool for researchers and practitioners who need to classify observations and understand the underlying relationships between predictor variables and group membership.
Needs help with similar assignment?
We are available 24x7 to deliver the best services and assignment ready within 3-4 hours? Order a custom-written, plagiarism-free paper
