How Does Cox Regression Work in SPSS? A Comprehensive Guide with Examples|2025
How does Cox Regression work in SPSS? Understand its functionality and steps for effective survival analysis.
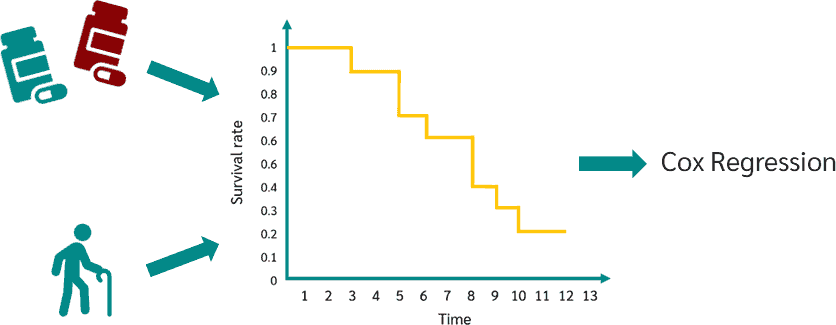
Cox regression, also known as Cox proportional hazards regression, is a statistical method widely used in survival analysis to examine the association between predictor variables and the time until an event occurs. This article explores how Cox regression works in SPSS, provides examples of univariate and multivariate Cox regression, and explains how to interpret and report the results. We will also discuss key terms such as the reference category, and the resources available from Laerd Statistics for performing Cox regression in SPSS.
Understanding Cox Regression
Cox regression is a semi-parametric model that does not require specifying the underlying hazard function, making it highly versatile. The method is used to estimate the hazard ratio (HR), which describes the effect of a predictor variable on the likelihood of an event occurring at a specific time point, while accounting for other variables in the model.
The fundamental equation in Cox regression is:
Here:
- is the hazard function at time given predictors .
- is the baseline hazard function.
- are the coefficients of the predictors.
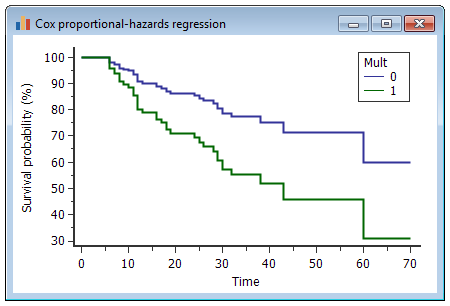
The Cox model assumes proportional hazards, meaning the effect of a predictor on the hazard is constant over time.
Steps for Performing Cox Regression in SPSS
Step 1: Prepare the Data
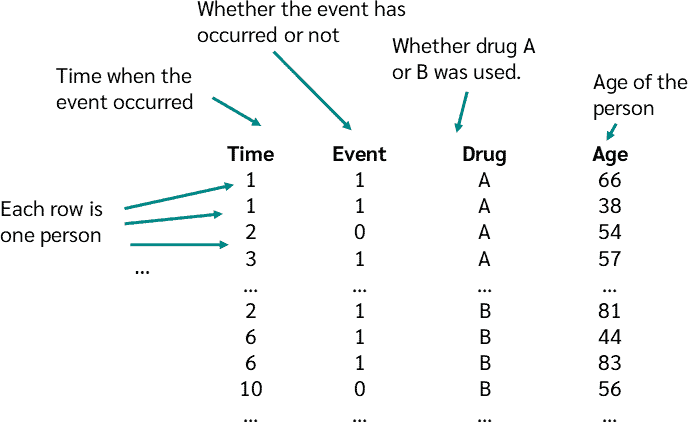
SPSS requires survival data in a specific format. Key variables include:
- Time variable: The duration until the event or censoring.
- Status variable: Indicates whether the event occurred (coded as 1) or the observation was censored (coded as 0).
- Predictor variables: Independent variables, which can be categorical or continuous.
Step 2: Open the Cox Regression Dialog Box
In SPSS:
- Navigate to Analyze > Survival > Cox Regression.
- Select the time variable for “Time” and the status variable for “Status.”
- Define the event value (e.g., 1 for the event occurring).
- Add predictors to the “Covariates” box.
Step 3: Run the Analysis
Click OK to run the Cox regression. SPSS outputs include the model summary, coefficients, and tests of proportional hazards.
Cox Regression Example
Imagine a study investigating factors influencing the time until hospital readmission. Variables include:
- Time to readmission (in days).
- Readmission status (1 = yes, 0 = censored).
- Age, gender, and treatment type as predictors.
Univariate Cox Regression SPSS Example
A univariate analysis examines the effect of a single predictor. For example, to test the impact of age:
- Add “Age” as the sole covariate.
- Run the analysis.
SPSS outputs:
- Hazard Ratio (Exp(B)): Indicates the increase or decrease in hazard for each unit increase in age.
- Significance (p-value): Determines whether the effect is statistically significant.
Interpretation:
- If Exp(B) = 1.05 and p < 0.05, a one-year increase in age increases the hazard by 5%.
Multivariate Cox Regression SPSS Example
A multivariate analysis includes multiple predictors. For example:
- Add “Age,” “Gender,” and “Treatment Type” as covariates.
- Specify the reference category for categorical variables (e.g., “Male” for Gender).
- Run the analysis.
SPSS outputs:
- Model Summary: Indicates the overall model fit (e.g., -2 log likelihood, Chi-square).
- Coefficients Table: Lists hazard ratios, confidence intervals, and p-values for all predictors.
Interpretation:
- If Treatment Type (reference: Standard) has Exp(B) = 0.70 and p < 0.05, the hazard is reduced by 30% for the experimental treatment.
Key Concepts in Cox Regression Interpretation
Hazard Ratio (HR)
The HR reflects the relative risk of the event occurring. Values:
- HR = 1: No effect.
- HR > 1: Increased hazard.
- HR < 1: Decreased hazard.
Reference Category
When analyzing categorical variables, SPSS uses a reference category to compare other groups. For example:
- Gender: Female (reference).
- Treatment Type: Standard (reference). SPSS reports hazard ratios relative to the reference category.
Proportional Hazards Assumption
This assumption must be satisfied for valid Cox regression results. Check using:
- Log-minus-log plots: Lines should be parallel.
- Time-dependent covariates: Add interactions with time to test.
How to Report Cox Regression Results
When reporting results, include:
- Model Fit: Report -2 log likelihood and Chi-square values.
- Predictor Effects: Provide hazard ratios, confidence intervals, and p-values.
- Interpretation: Explain the practical significance of findings.
Example: “A multivariate Cox regression model was conducted to examine factors influencing hospital readmission. The model was statistically significant (χ² = 25.4, p < 0.001). Age was associated with increased readmission risk (HR = 1.03, 95% CI: 1.01–1.05, p = 0.01), while experimental treatment reduced the hazard (HR = 0.75, 95% CI: 0.60–0.92, p = 0.004).”
Using Laerd Statistics for Cox Regression in SPSS
Laerd Statistics provides detailed, user-friendly tutorials on conducting Cox regression in SPSS. These guides include:
- Step-by-step instructions with screenshots.
- Assumption checks.
- Interpretation of outputs.
For example, their “Cox Regression in SPSS” guide covers:
- Preparing data.
- Performing univariate and multivariate analyses.
- Addressing proportional hazards violations.
Conclusion
Cox regression in SPSS is a powerful tool for survival analysis, enabling researchers to explore relationships between predictors and the time to an event. Whether performing univariate or multivariate analyses, understanding key concepts such as the hazard ratio, reference category, and proportional hazards assumption is crucial. By leveraging resources like Laerd Statistics, users can confidently interpret and report their results.
Needs help with similar assignment?
We are available 24x7 to deliver the best services and assignment ready within 3-4 hours? Order a custom-written, plagiarism-free paper
