How to Measure the Statistical Association Test|2025
/in SPSS Articles /by BesttutorDiscover how to measure the statistical association test effectively. Learn key methods, tools, and techniques to analyze relationships between variables in your data.
In the field of statistics, association tests are essential for determining whether there is a relationship or dependency between two or more variables. These tests are widely used in research to analyze patterns, relationships, and trends within data. Understanding how to measure the statistical association between variables helps researchers make informed decisions based on empirical evidence. This paper explores how to measure statistical associations using different methods, with a particular focus on the use of Statistical Package for the Social Sciences (SPSS), a widely used software in data analysis. We will cover the types of association tests, their applications in research, and provide examples of how they can be conducted in SPSS.

Table of Contents
ToggleUnderstanding Statistical Association
Statistical association refers to the relationship between two or more variables. It indicates the extent to which changes in one variable correspond with changes in another. Association does not necessarily imply causation but provides a foundation for identifying patterns and making predictions.
There are various ways to measure statistical association depending on the nature of the variables being analyzed. The key distinction lies in whether the variables are continuous or categorical. Therefore, different statistical tests are employed based on this distinction.
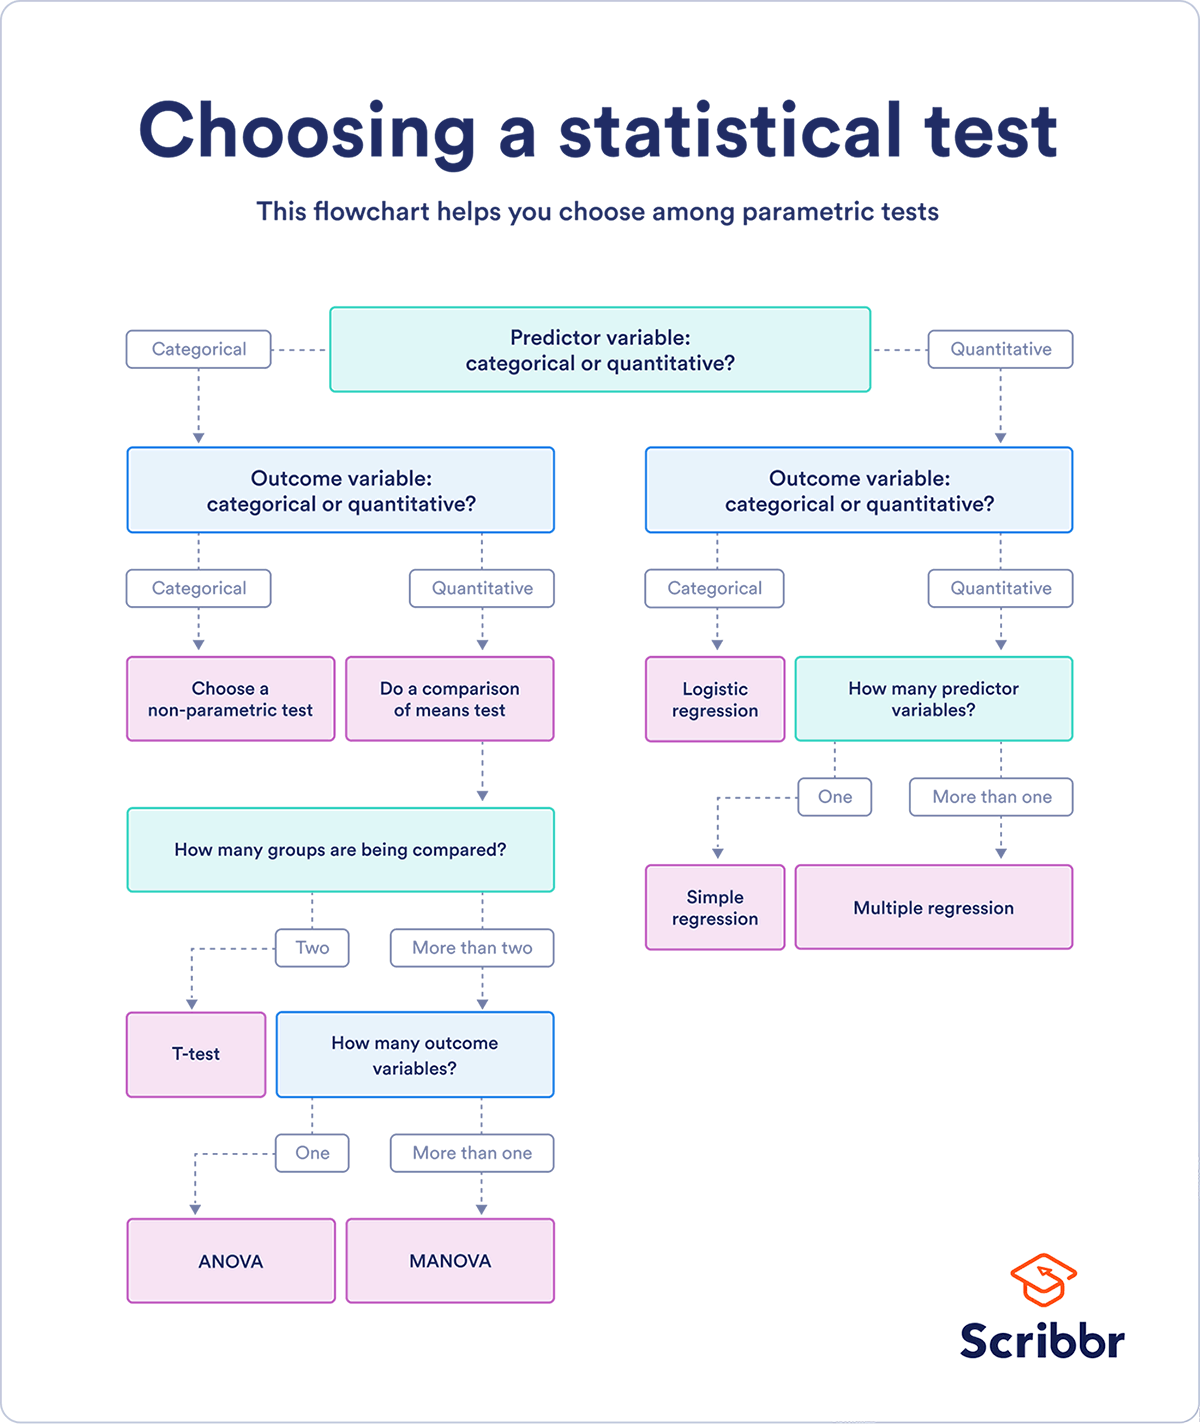
Types of Statistical Tests for Association
- Chi-Square Test of Independence: This test is commonly used to measure the association between two categorical variables. It evaluates whether the observed frequencies of categories differ significantly from the expected frequencies under the assumption of independence.Example: A study might investigate whether gender is associated with voting preference (Male/Female and Democrat/Republican).
- Pearson Correlation Coefficient (r): The Pearson correlation coefficient is a statistical measure that determines the strength and direction of the linear relationship between two continuous variables. The value of rrr ranges from -1 to 1, where:
- 1 indicates a perfect positive correlation,
- -1 indicates a perfect negative correlation,
- 0 indicates no linear correlation.
Example: A researcher might explore the relationship between income and education level, where both variables are continuous.
- Spearman’s Rank Correlation: This non-parametric test is used to measure the strength and direction of the relationship between two ranked variables. It is often used when the data are not normally distributed or when the relationship between the variables is not linear.Example: The association between the rankings of students in two different subjects could be measured using Spearman’s rank correlation.
- T-tests and ANOVA: Although not typically described as tests of association, these tests can be used to compare the means of continuous variables across different categorical groups, indirectly testing the relationship between variables.Example: A researcher might use an ANOVA test to assess whether there are significant differences in average income levels across different age groups.

How to Measure the Statistical Association Test in SPSS
SPSS provides a user-friendly platform for conducting statistical tests and measuring associations between variables. Depending on the type of variables and research objectives, various tests can be performed to assess statistical associations. The following steps outline how to conduct statistical tests for association in SPSS.
How to Measure the Statistical Association Test in SPSS: Chi-Square Test of Independence
The Chi-Square test is often used when the variables are categorical. It tests the null hypothesis that there is no association between the variables.
Steps in SPSS:
- Prepare the data: Organize the data in a crosstabulation table where the rows represent one categorical variable and the columns represent another.
- Access the test: In SPSS, click on
Analyze→Descriptive Statistics→Crosstabs. - Input the variables: Move the variables of interest into the
Row(s)andColumn(s)boxes. - Run the test: Click on
Statisticsand check the box forChi-Square. ClickContinueand thenOKto run the test. - Interpret the results: SPSS will provide a Chi-Square statistic, the degrees of freedom (df), and the p-value. A significant p-value (typically < 0.05) indicates that there is an association between the two variables.
How to Measure the Statistical Association Test in SPSS: Pearson Correlation
When dealing with continuous variables, Pearson’s correlation coefficient measures the strength and direction of the linear relationship between two variables.
Steps in SPSS:
- Prepare the data: Ensure that the two continuous variables are entered into the SPSS data sheet.
- Access the test: Click on
Analyze→Correlate→Bivariate. - Input the variables: Move the continuous variables into the
Variablesbox. - Select correlation method: Check the box for
Pearson. - Run the test: Click
OKto perform the test. - Interpret the results: SPSS will provide the Pearson correlation coefficient (r), the significance value (p-value), and the sample size (N). A correlation value close to 1 or -1 indicates a strong linear relationship, while a value close to 0 indicates no linear relationship.
How to Measure the Statistical Association Test in SPSS: Spearman’s Rank Correlation
If your data is not continuous or does not meet the assumptions for Pearson’s correlation, Spearman’s rank correlation is a better alternative for measuring association.
Steps in SPSS:
- Prepare the data: Rank the variables if needed.
- Access the test: Click on
Analyze→Correlate→Bivariate. - Input the variables: Move the two variables into the
Variablesbox. - Select correlation method: Check the box for
Spearman. - Run the test: Click
OKto execute the test. - Interpret the results: SPSS will output the Spearman rank correlation coefficient and the p-value. A significant p-value indicates a statistically significant association between the variables.

Statistical Test for Association Between Two Variables
The type of statistical test to use depends on the level of measurement of the variables.
- Chi-Square Test for Categorical Variables: If both variables are categorical, the Chi-Square test is the best option for determining if there is an association.
- Pearson Correlation for Continuous Variables: For continuous variables, Pearson’s correlation is often the most appropriate measure.
- Spearman’s Rank Correlation for Ordinal Data: If the variables are ordinal, or if assumptions for Pearson’s correlation are not met, Spearman’s rank correlation is used.
- T-test or ANOVA for Group Comparisons: If you are comparing means of a continuous variable across two or more groups, t-tests or ANOVA can be useful.
Statistical Test for Association Between Two Continuous Variables
When examining the relationship between two continuous variables, Pearson’s correlation coefficient is typically used. This test measures the strength and direction of a linear relationship between the variables. If the data is not normally distributed, you can use Spearman’s rank correlation as an alternative.
Example: A researcher may want to assess whether there is an association between height and weight in a sample of individuals. Pearson’s correlation would be suitable here to measure the linear association.
Test of Association Examples
Let’s consider a few examples of association tests:
- Chi-Square Test of Independence Example: A study investigates whether there is an association between smoking habits (Yes/No) and gender (Male/Female). Using the Chi-Square test, the researcher can test if gender and smoking habits are independent or related.
- Pearson Correlation Example: A researcher examines the association between the amount of time spent studying and the students’ exam scores. Pearson’s correlation can be calculated to determine whether a positive relationship exists between the two continuous variables.
- Spearman’s Rank Correlation Example: A study is conducted to determine whether the ranking of students in mathematics correlates with their ranking in science. As the data is ordinal, Spearman’s rank correlation would be an appropriate test to measure the association.
Conclusion
Measuring statistical associations between variables is a fundamental aspect of data analysis in research. Whether you are dealing with categorical or continuous data, there are various tests available, including the Chi-Square test, Pearson correlation, and Spearman’s rank correlation. SPSS is a powerful tool that simplifies the process of calculating and interpreting these tests. By understanding the correct statistical tests and their application in research, you can gain valuable insights into the relationships between variables and make informed decisions based on empirical data.
Through a deeper understanding of these statistical techniques and their practical implementation in SPSS, researchers can effectively assess associations and contribute to the body of knowledge in their respective fields.
Needs help with similar assignment?
We are available 24x7 to deliver the best services and assignment ready within 3-4 hours? Order a custom-written, plagiarism-free paper
