How to Run a Normality Test in SPSS|2025
/in SPSS Articles /by BesttutorLearn how to run a Normality Test in SPSS with this step-by-step guide, covering data preparation, test execution, and interpretation of results to assess data distribution.
In statistical analysis, one of the foundational assumptions is the normality of the data, especially when employing parametric tests like t-tests, ANOVA, and regression analysis. The assumption is that data follows a normal distribution, but how can we verify this assumption? In this paper, we will explore how to run normality tests in SPSS, which is a widely used statistical software package. We will cover various methods for checking normality, including tests such as the Kolmogorov-Smirnov test and the Shapiro-Wilk test, as well as how to interpret the results.
Understanding the proper steps to conduct a normality test in SPSS and interpreting the outcomes correctly is crucial for ensuring the validity of your statistical analyses. Let’s explore how to check for normality in SPSS, step by step.
Table of Contents
ToggleWhat is Normality?
Before diving into the specifics of SPSS, it’s essential to understand what normality means in the context of statistical analysis. Normality refers to whether the data follows a normal distribution, also known as a bell curve. This is critical because many statistical tests assume that the data follows a normal distribution. When data is normally distributed, the mean, median, and mode coincide, and the distribution is symmetric around the mean.
Types of Normality Tests in SPSS
SPSS provides several ways to assess whether data is normally distributed. Among the most commonly used tests are the Kolmogorov-Smirnov test and the Shapiro-Wilk test. Both of these tests are available in SPSS and can be used to assess the normality of your dataset.
How to Run Normality Test in SPSS: A Step-by-Step Guide
Running a normality test in SPSS is relatively simple and involves a few key steps. Below is a detailed guide on how to perform a normality test in SPSS using both graphical and statistical methods.
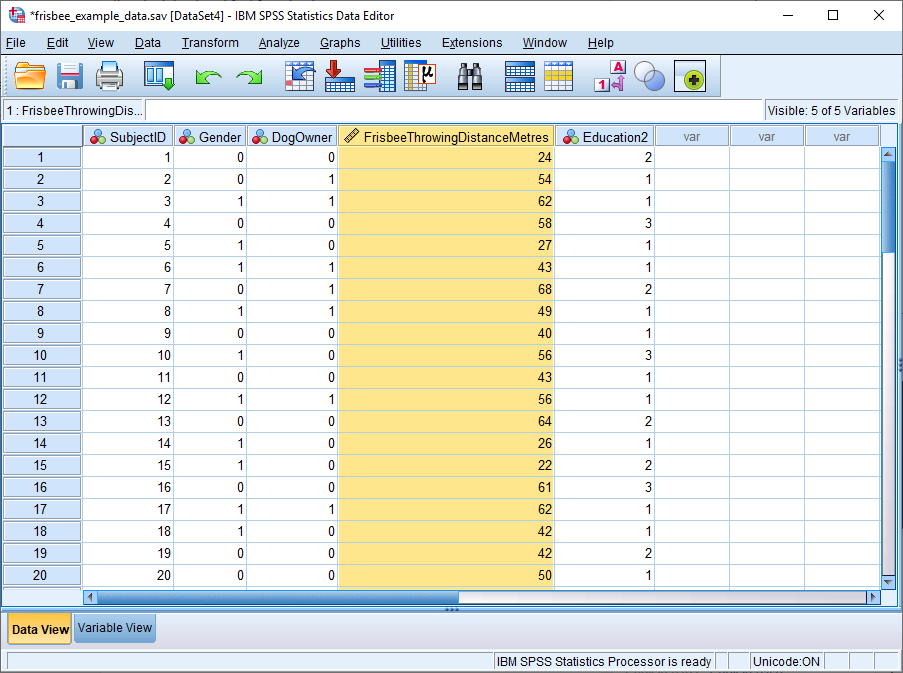
Step 1: Preparing the Data in SPSS
First, ensure that your dataset is loaded in SPSS. For example, if you are working with a dataset that has multiple variables, you should first ensure that each variable is correctly entered into SPSS.
- Open SPSS and load your dataset.
- Check the data to ensure there are no missing values or outliers in your variables, as they can affect the results of the normality tests.
Step 2: Visual Inspection Using Histograms and Q-Q Plots
One of the first methods of examining normality in SPSS is through visual inspection. SPSS allows you to generate both histograms and Q-Q plots, which can give you a rough idea of the data’s distribution.
To create a histogram in SPSS:
- Go to Graphs in the main menu.
- Select Legacy Dialogs, and then click on Histogram.
- Choose the variable you wish to analyze, and click OK.
The histogram will show you the shape of the distribution. A bell-shaped curve suggests that the data may be normally distributed.
To create a Q-Q plot in SPSS:
- Go to Analyze > Descriptive Statistics > Q-Q Plots.
- Select the variable you wish to analyze.
- Click OK.
A Q-Q plot compares your data to a standard normal distribution. If the data points closely follow the diagonal line, this is an indication that the data may be normally distributed.
Step 3: Running the Shapiro-Wilk Test in SPSS
The Shapiro-Wilk test is a commonly used test for normality and is available in SPSS. This test is particularly useful when you have small sample sizes, as it is considered more reliable for smaller datasets.
To perform the Shapiro-Wilk test in SPSS:
- Go to Analyze > Descriptive Statistics > Explore.
- In the dialog box, move the variable you wish to test for normality into the Dependent List box.
- Click on Plots in the lower-right corner of the window.
- In the Plots menu, check the box next to Normality plots with tests.
- Click Continue, then click OK to run the test.
In the output window, you will see the results of the Shapiro-Wilk test, along with the associated significance value (p-value). If the p-value is greater than 0.05, it suggests that the data does not significantly differ from a normal distribution, meaning the data is approximately normal.
Step 4: Running the Kolmogorov-Smirnov Test in SPSS
The Kolmogorov-Smirnov test is another normality test available in SPSS. It compares the distribution of your data with a normal distribution and provides a test statistic and p-value.
To perform the Kolmogorov-Smirnov test:
- Go to Analyze > Descriptive Statistics > Explore.
- Select the variable for which you wish to test normality.
- Click on Plots and check the Normality plots with tests box.
- Click OK.
In the output, you will find the results of the Kolmogorov-Smirnov test. If the p-value is greater than 0.05, it indicates that the data is normally distributed. If the p-value is less than 0.05, this suggests that the data significantly deviates from a normal distribution.
Step 5: Conducting a Normality Test for Multiple Variables in SPSS
If you want to test the normality of multiple variables simultaneously, you can do so by selecting multiple variables in the same procedure. The process is similar to testing a single variable, but you simply select more than one variable to include in the Dependent List box.
To run a normality test on multiple variables:
- Go to Analyze > Descriptive Statistics > Explore.
- Select the variables you wish to test and move them to the Dependent List.
- Click Plots, and check Normality plots with tests.
- Click Continue, and then click OK to run the analysis.
SPSS will provide normality test results (Shapiro-Wilk and Kolmogorov-Smirnov) for each of the selected variables, and you can easily compare the results across multiple variables.
Step 6: Interpreting the Results of Normality Tests
Once you have run the normality tests, you need to interpret the results correctly to make informed decisions about your analysis.
- Shapiro-Wilk Test: If the p-value is greater than 0.05, you fail to reject the null hypothesis and conclude that the data is normally distributed. If the p-value is less than 0.05, you reject the null hypothesis and conclude that the data is not normally distributed.
- Kolmogorov-Smirnov Test: Similar to the Shapiro-Wilk test, a p-value greater than 0.05 suggests that the data follows a normal distribution. If the p-value is less than 0.05, the data is not normally distributed.
Step 7: Visual Inspection of Normality
In addition to the tests, you can also use graphical methods such as histograms, Q-Q plots, and box plots to visually inspect the distribution of your data. These visualizations are particularly useful when working with large datasets or when the normality tests return borderline results.
Histogram Interpretation:
- A bell-shaped curve in the histogram suggests normality.
- Skewness to the left or right indicates non-normality.
Q-Q Plot Interpretation:
- If the data points closely align with the diagonal line, the data is normally distributed.
- Deviations from the line suggest a departure from normality.
Conclusion
Running a normality test in SPSS is a simple process that can be done using either graphical methods or statistical tests like the Shapiro-Wilk and Kolmogorov-Smirnov tests. Normality is a key assumption in many parametric tests, and checking for it ensures the validity of your analysis. Understanding how to run these tests and interpret the results is essential for making accurate inferences from your data.
By following the steps outlined in this paper, you will be able to effectively test for normality in SPSS, whether you’re working with a single variable or multiple variables, and make informed decisions about the subsequent statistical tests to apply.
In summary, normality tests like the Shapiro-Wilk and Kolmogorov-Smirnov tests in SPSS offer useful tools for assessing the normality of your data. Interpreting the results and using visualizations like histograms and Q-Q plots can help you make confident decisions regarding the assumptions of normality in your analyses.
Needs help with similar assignment?
We are available 24x7 to deliver the best services and assignment ready within 3-4 hours? Order a custom-written, plagiarism-free paper
