How to Run Chi-Square Test in SPSS|2025
Learn How to Run Chi-Square Test in SPSS with our easy-to-follow guide. Perfect for analyzing categorical data and testing relationships between variables. Master SPSS today!
The chi-square test is a statistical method used to determine if there is a significant association between categorical variables. It is widely used in social sciences, medicine, and business research. SPSS (Statistical Package for the Social Sciences) provides a user-friendly interface for conducting chi-square tests, making it easier for researchers to analyze categorical data. This paper explains how to perform a chi-square test in SPSS, interpret the output, and report the results.
Understanding the Chi-Square Test
The chi-square test is a non-parametric statistical test used to examine relationships between categorical variables. There are two main types of chi-square tests:
- Chi-Square Test of Independence: Determines whether two categorical variables are independent of each other.
- Chi-Square Test of Goodness-of-Fit: Tests whether an observed distribution matches an expected distribution.
This paper primarily focuses on the chi-square test of independence, which is commonly used in SPSS to analyze associations between categorical variables.
Running a Chi-Square Test in SPSS
To conduct a chi-square test in SPSS, follow these steps:
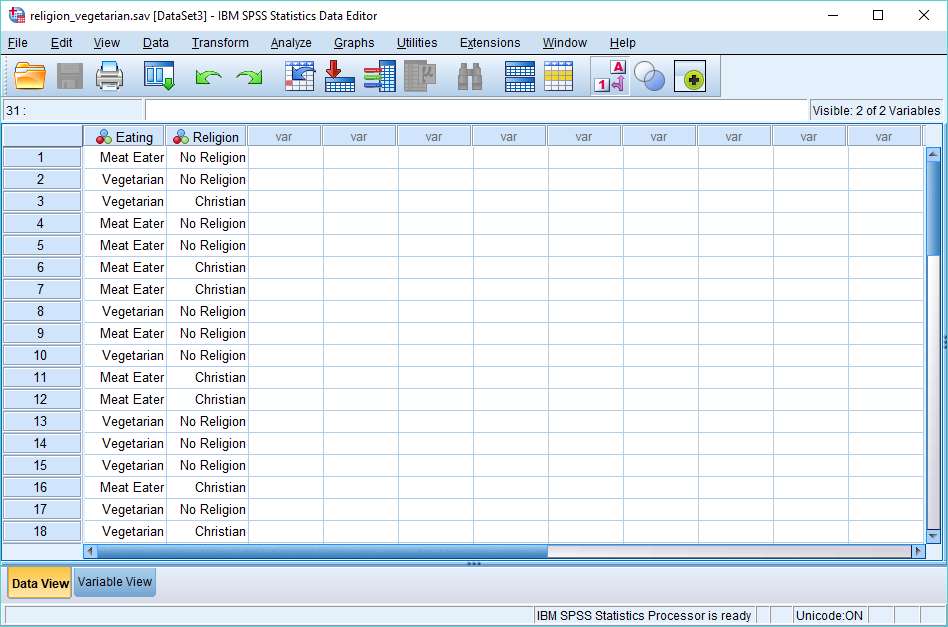
Step 1: Input Data
- Open SPSS and enter your categorical data into the Data View tab.
- Assign appropriate labels to your variables in the Variable View tab.
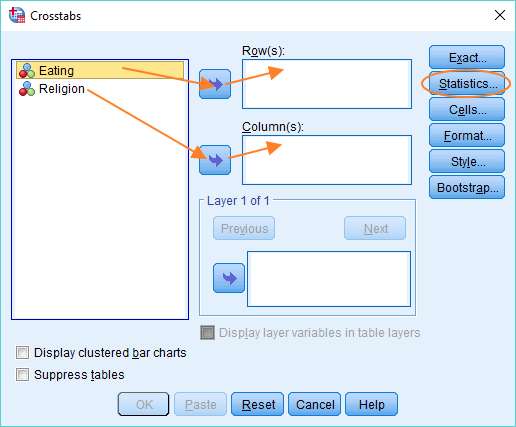
Step 2: Open the Crosstabs Function
- Click on Analyze > Descriptive Statistics > Crosstabs.
- Move the categorical variables into the Rows and Columns fields.
- Click on the Statistics button and check the box for Chi-square.
- Click Continue, then OK to run the test.
SPSS Output Interpretation
The chi-square test in SPSS produces several outputs, including:
Chi-Square Test Table
The Chi-Square Tests table contains:
- Pearson Chi-Square value: Indicates the test statistic.
- Degrees of freedom (df): Represents the number of categories minus one.
- Asymptotic Significance (p-value): If p < 0.05, there is a statistically significant association between the variables.
Crosstabulation Table
This table shows the observed and expected frequencies for each category.
Interpretation
- If the p-value is less than 0.05, reject the null hypothesis and conclude that there is a significant association between the variables.
- If the p-value is greater than 0.05, fail to reject the null hypothesis, indicating no significant association.
Chi-Square Test More Than 2 Groups in SPSS
For a chi-square test involving more than two groups, follow the same procedure, ensuring that all categories are represented in the dataset. The interpretation remains the same: if the p-value is significant, there is an association among the groups.
Chi-Square Test of Independence – SPSS
The chi-square test of independence in SPSS assesses whether two categorical variables are related. For example, a study examining the relationship between smoking (Yes/No) and lung disease (Yes/No) would use this test. The steps remain the same as described earlier.
How to Interpret Chi-Square Results
- Examine the chi-square statistic: Higher values indicate a stronger relationship.
- Check the p-value: Determines statistical significance.
- Review the expected vs. observed frequencies: Large discrepancies indicate a strong association.
Chi-Square Test of Association Example
Consider a study analyzing the relationship between gender (Male/Female) and preference for a political party (Party A/Party B). If the p-value in the chi-square test is significant, we conclude that gender and political preference are associated.
How to Report Chi-Square Results
When reporting chi-square results in research papers, follow APA guidelines: Example: “A chi-square test of independence was performed to examine the relationship between gender and political preference. The results indicated a significant association between the variables, .”
Conclusion
The chi-square test in SPSS is a powerful tool for analyzing categorical data. By following the outlined steps, interpreting SPSS output correctly, and understanding how to report results, researchers can effectively apply this statistical test in their studies.
Needs help with similar assignment?
We are available 24x7 to deliver the best services and assignment ready within 3-4 hours? Order a custom-written, plagiarism-free paper
