How to Run Descriptive Statistic Test in SPSS|2025
Learn How to Run Descriptive Statistic Test in SPSS with step-by-step guidance. Discover key techniques to analyze data effectively and interpret results easily.
Descriptive statistics play a fundamental role in data analysis, providing essential insights into the basic features of a dataset. They summarize and describe data characteristics, such as mean, median, standard deviation, and frequency distribution. SPSS (Statistical Package for the Social Sciences) is one of the most popular tools for performing descriptive statistical tests due to its user-friendly interface and powerful capabilities. This paper explains how to run descriptive statistic tests in SPSS, offering detailed steps, examples, and interpretation.
What Are Descriptive Statistics?
Descriptive statistics are used to summarize and organize data so that patterns and trends are more evident. Commonly used descriptive statistics include:
- Measures of Central Tendency: Mean, median, and mode.
- Measures of Dispersion: Range, variance, and standard deviation.
- Frequency Distribution: Counts and percentages of categorical data.
- Graphical Summaries: Histograms, bar charts, and boxplots.
By running a descriptive statistic test in SPSS, you can quickly analyze large datasets, enabling informed decisions and interpretations.
How to Run Descriptive Statistic Test in SPSS Using SPSS
Step 1: Open Your Dataset
- Launch SPSS and open your dataset.
- If you don’t have a dataset ready, you can create one by entering data manually in the “Data View” tab or importing data from formats like Excel, CSV, or text files.
Step 2: Select the Variables
Choose the variables for which you want to run descriptive statistics. For example, if analyzing survey responses, you might focus on variables like age, income, or gender.
Step 3: Access the Descriptive Statistics Menu
- Navigate to Analyze > Descriptive Statistics > Descriptives.
- A dialog box will appear, prompting you to select variables.
Step 4: Add Variables to the Analysis
- Move the variables of interest from the left panel to the “Variables” box on the right by selecting them and clicking the arrow.
- For example, to analyze age and income, highlight these variables and add them.
Step 5: Choose Additional Options
- Click the Options button.
- Select statistics you wish to calculate, such as mean, standard deviation, minimum, and maximum.
- Click Continue to confirm your choices.
Step 6: Run the Test
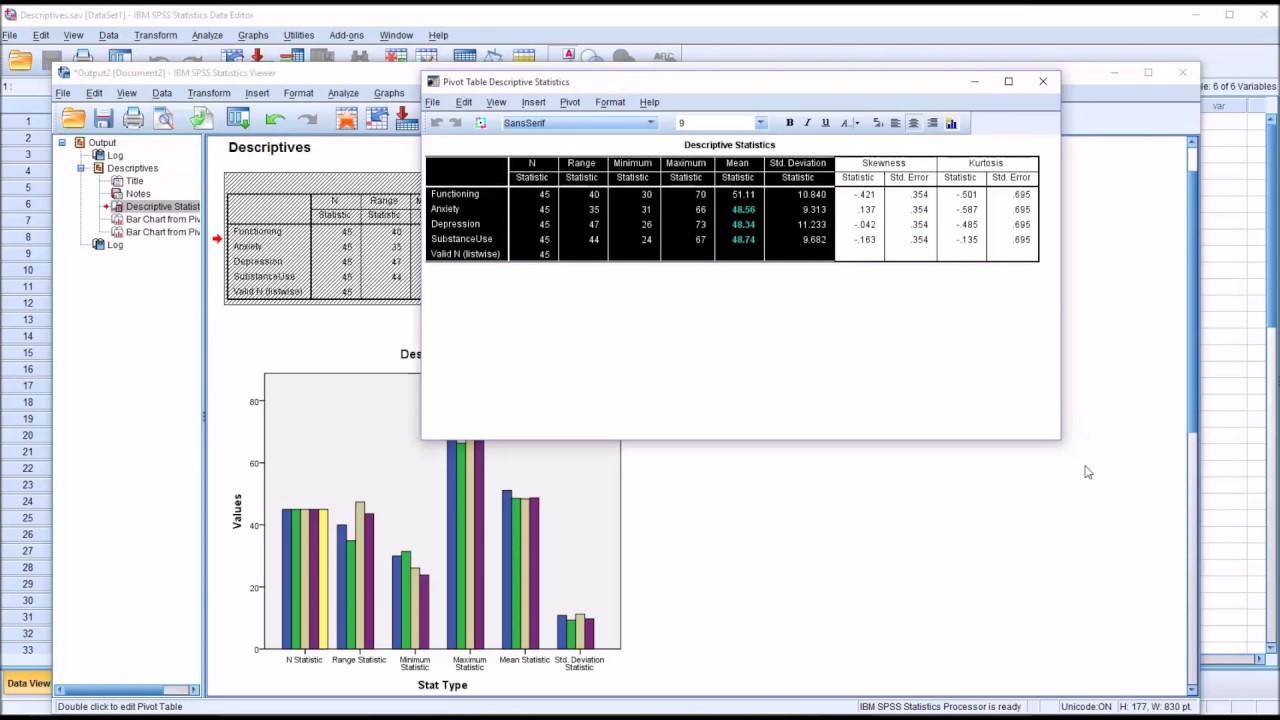
Click OK to execute the descriptive statistic test. SPSS will generate output in a new “Output Viewer” window.
Step 7: Save the Results
You can export the output to a PDF by selecting File > Export > PDF in the Output Viewer.
How to Run Descriptive Statistic Test in SPSS Example
Let’s walk through an example:
Scenario:
A researcher wants to analyze the age and income distribution of 100 survey respondents.
Steps:
- Open the dataset containing age and income variables.
- Go to Analyze > Descriptive Statistics > Descriptives.
- Select “Age” and “Income” and move them to the “Variables” box.
- Click Options and check “Mean,” “Standard Deviation,” “Minimum,” and “Maximum.”
- Click OK to generate the output.
Results:
The output table might look like this:
| Variable | Mean | Std. Deviation | Minimum | Maximum |
|---|---|---|---|---|
| Age | 35.6 | 8.5 | 20 | 60 |
| Income | 55000 | 15000 | 30000 | 85000 |
Interpretation:
- The average age of respondents is 35.6 years.
- The standard deviation of 8.5 indicates moderate variability in age.
- Income ranges from $30,000 to $85,000, with an average of $55,000.
Descriptive Statistics in SPSS with Interpretation
Proper interpretation of descriptive statistics results is crucial for meaningful analysis. Here are some guidelines:
Central Tendency:
-
- Use the mean to describe the central point of continuous variables.
- The median is helpful when the data is skewed or has outliers.
- The mode is suitable for categorical data.
Dispersion:
-
- A small standard deviation indicates data points are close to the mean, while a large one shows greater spread.
- The range provides a quick view of data spread but is sensitive to outliers.
Frequency Tables:
-
- Useful for categorical data like gender or occupation.
- Example: If 60% of respondents are female and 40% are male, interpret this in the context of your research question.
Graphs and Visualizations:
-
- Use histograms to observe the distribution of continuous variables.
- Boxplots are ideal for identifying outliers.
How to Interpret Descriptive Statistics Results in SPSS PDF
To share descriptive statistics results with stakeholders, you may want to interpret them in a professional report or export them as a PDF. Follow these steps:
Steps to Export Results:
- After running the test, go to the Output Viewer.
- Select File > Export > PDF.
- Save the file to your preferred location.
Example of Interpretation in a PDF Report:
Dataset Summary: The dataset includes 200 participants, with variables such as age, gender, income, and education level. Below are the descriptive statistics for key variables:
Age:
- Mean: 30.2 years
- Standard Deviation: 5.7
- Range: 20 to 45 years
Income:
- Mean: $45,000
- Standard Deviation: $10,000
- Minimum: $25,000
- Maximum: $70,000
Interpretation:
- The participants’ ages show moderate variability, with a majority clustered around the mean of 30.2 years.
- Income levels reveal a broader spread, likely influenced by diverse occupations among participants.
How to Run Descriptive Statistic Test in SPSS Using SPS
The acronym “SPS” often refers to SPSS but may denote specific shortcuts or simplified commands within SPSS software. To run descriptive statistics using SPSS, adhere to the previously outlined steps for selecting variables and executing the test.
For instance:
- Shortcut Command: Use “Analyze > Descriptive Statistics > Frequencies” to generate frequency tables quickly.
How to Run Descriptive Statistics in SPSS for Gender
Analyzing gender as a categorical variable requires frequency tables and charts.
Steps:
- Go to Analyze > Descriptive Statistics > Frequencies.
- Select “Gender” as the variable.
- Check “Display Frequency Tables.”
- Click OK to generate the output.
Example Output:
| Gender | Frequency | Percent |
| Male | 45 | 45% |
| Female | 55 | 55% |
| Total | 100 | 100% |
Interpretation:
- The dataset consists of 45% male and 55% female participants, indicating a slightly higher representation of females.

Conclusion
Running descriptive statistic tests in SPSS is a straightforward yet powerful process for summarizing and understanding datasets. By following the outlined steps, you can analyze variables such as age, income, and gender with ease. Moreover, proper interpretation of descriptive statistics results in SPSS enhances the quality of analysis, enabling effective communication of findings. Whether generating results for academic purposes or professional reports, SPSS provides the tools you need for efficient statistical analysis.
Needs help with similar assignment?
We are available 24x7 to deliver the best services and assignment ready within 3-4 hours? Order a custom-written, plagiarism-free paper
