How to Run Exploratory Factor Analysis in SPSS: A Comprehensive Guide|2025
/in General Articles /by BesttutorLearn how to run Exploratory Factor Analysis in SPSS with this comprehensive guide. Discover the steps, interpretation, and tips for analyzing complex data and identifying underlying factors.
Exploratory Factor Analysis (EFA) is a powerful statistical technique used to identify the underlying structure of a dataset by examining the interrelationships among variables. It is particularly useful when you have a large number of observed variables and wish to reduce the data into fewer, interpretable latent constructs or factors. EFA helps in discovering patterns, identifying relationships between variables, and determining how they group together to form underlying dimensions, which is essential in fields such as psychology, social sciences, marketing research, and many others.
In this comprehensive guide, we will discuss how to perform Exploratory Factor Analysis (EFA) in SPSS, how to interpret the results, and provide a step-by-step approach to achieve successful factor analysis for your data. Additionally, we will explore key concepts, assumptions, and best practices for reporting your findings.
Table of Contents
ToggleIntroduction to Exploratory Factor Analysis (EFA)
Factor analysis is divided into two main types: Exploratory Factor Analysis (EFA) and Confirmatory Factor Analysis (CFA). In EFA, the goal is to explore the possible underlying factor structure of the data without imposing any preconceived structure, whereas CFA tests a hypothesis or theory about the factor structure.
The primary objective of EFA is to reduce the dimensionality of the data by identifying patterns or groupings of variables that are correlated with one another. The underlying idea is that variables within a group or cluster (factor) are likely to be related to the same latent construct. For instance, in a survey assessing customer satisfaction, multiple observed variables (e.g., quality of service, staff attitude, waiting time) may all load on a single latent factor such as “Service Quality.”
Key goals of Exploratory Factor Analysis include:
- Data Reduction: To reduce a large set of variables into a smaller set of factors, simplifying the data.
- Identifying Patterns: To identify patterns of correlations between variables.
- Establishing Construct Validity: To group variables together that represent underlying latent constructs or dimensions.
Assumptions of Exploratory Factor Analysis (EFA)
Before conducting an EFA in SPSS, it’s crucial to ensure that certain assumptions are met for the analysis to be valid:
- Linearity: The relationships between the variables are linear. This means that the correlations between variables should be sufficiently linear for EFA to be effective.
- Large Sample Size: A larger sample size is preferred. Generally, EFA works best with a sample size of at least 100-200 cases. A larger sample size enhances the stability and generalizability of the results.
- Correlation Among Variables: Variables should show reasonable correlations with one another (e.g., a correlation coefficient of at least 0.3). If variables are not correlated, factor analysis may not be appropriate.
- Normality: Although EFA can tolerate some deviation from normality, data that are highly skewed or have extreme outliers can affect the results. SPSS allows for assessing normality through descriptive statistics or visualizations.
- Sufficient Variance: There must be sufficient variance in the data. If the data lacks variance, factor analysis may not detect meaningful patterns.
- No Multicollinearity: Variables should not be highly collinear (i.e., not too closely correlated), as this can distort the factor extraction process.
Preparing Your Data for Exploratory Factor Analysis in SPSS
Before running an EFA in SPSS, it’s essential to prepare your data to ensure the analysis is conducted properly:
- Check for Missing Data: Use SPSS’s data handling capabilities to handle missing data appropriately. The missing data can be dealt with using multiple imputation or listwise deletion, depending on the amount of missingness and the nature of the data.
- Check for Outliers: Outliers can distort the results of factor analysis. It is important to identify and either correct or remove extreme outliers using SPSS’s statistical procedures.
- Verify Data Types: EFA is typically used for continuous or ordinal data. Ensure that all the variables involved are numeric. Categorical variables should not be included in the analysis.
- Correlation Matrix: Ensure that your dataset contains variables that are sufficiently correlated. SPSS provides a correlation matrix that can be used to check this. If correlations are too low (i.e., below 0.3), EFA may not yield meaningful results.
Conducting Exploratory Factor Analysis in SPSS
Running Exploratory Factor Analysis in SPSS involves several key steps. Below is a detailed, step-by-step guide to help you perform EFA.
Step 1: Open Your Dataset in SPSS
- Launch SPSS and open your dataset. Ensure the dataset contains the variables you want to analyze in the factor analysis. These variables should be continuous and exhibit sufficient correlation.
- Review the dataset for any missing values, outliers, or data entry errors that need correction.
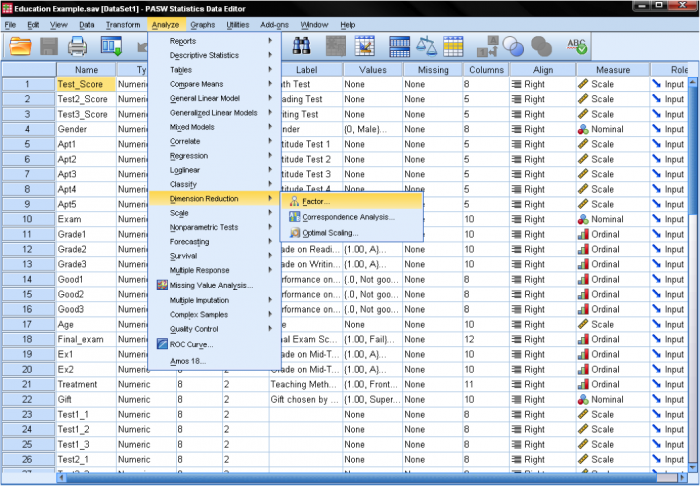
Step 2: Access the Factor Analysis Procedure
- From the SPSS menu, click on Analyze.
- In the drop-down menu, select Dimension Reduction, and then choose Factor. This will open the Factor Analysis dialog box.
Step 3: Select Variables for Factor Analysis
- In the Factor Analysis dialog box, move the variables you want to include in the factor analysis to the Variables box. These variables should be continuous and ideally show a moderate to high level of correlation.
- The more variables you include, the more comprehensive your analysis will be. However, you should be cautious not to include too many variables that are highly correlated with one another.
Step 4: Choose the Extraction Method
- In the Extract tab, SPSS offers several methods for extracting factors. The most common method is Principal Component Analysis (PCA), which is often used when the goal is data reduction. However, you can also choose Principal Axis Factoring (PAF) or Maximum Likelihood (ML) if you aim to understand the underlying structure and assume that factors have a probabilistic interpretation.
- Choose the extraction method that fits the purpose of your analysis. Typically, Principal Component Analysis is used when reducing the number of variables, while Principal Axis Factoring is used when focusing on the common variance shared between variables.
Step 5: Determine the Number of Factors to Extract
- In the Extract tab, you can specify the number of factors you want to extract. Alternatively, you can let SPSS determine the number of factors based on eigenvalues greater than 1 or through a scree plot (a visual representation of the eigenvalues).
- You can choose to extract a fixed number of factors or use the Eigenvalue greater than 1 criterion, which means that factors with eigenvalues greater than 1 will be retained.
Step 6: Factor Rotation (Optional)
- In the Rotation tab, you can select a rotation method. The two most common rotation methods are Varimax (orthogonal rotation) and Promax (oblique rotation).
- Varimax is used when you assume that factors are uncorrelated.
- Promax is used when you expect the factors to be correlated.
- Rotation improves the interpretability of the factor structure by maximizing the variance of the factor loadings, making it easier to identify which variables load on which factors.
Step 7: Save Factor Scores (Optional)
- If you want to save the factor scores for further analysis, you can do so by selecting the Save button in the dialog box. This will allow you to create new variables that represent the factor scores for each case in the dataset.
Step 8: Run the Analysis
- Once you’ve configured all the settings, click on the OK button to run the factor analysis. SPSS will produce a variety of output, including eigenvalues, factor loadings, and communalities.
Interpreting the Results of Exploratory Factor Analysis
The output generated by SPSS after running an EFA includes several key tables. Here is a guide to interpreting each part of the output.
1. KMO and Bartlett’s Test of Sphericity
- The Kaiser-Meyer-Olkin (KMO) Measure of Sampling Adequacy tests whether the data is suitable for factor analysis. Values above 0.6 are generally considered acceptable, with values closer to 1 indicating that the data is highly suitable for EFA.
- The Bartlett’s Test of Sphericity tests whether the correlation matrix is significantly different from the identity matrix. A significant p-value (less than 0.05) indicates that the data is suitable for factor analysis.
2. Total Variance Explained
- The Total Variance Explained table shows the eigenvalues and the percentage of variance explained by each factor. Factors with eigenvalues greater than 1 are typically considered significant.
- The cumulative percentage of variance explained tells you how much of the total variance in your data is accounted for by the factors.
3. Rotated Component Matrix
- The Rotated Component Matrix shows the factor loadings after rotation. A factor loading represents the correlation between a variable and a factor. A loading above 0.4 is typically considered significant.
- Variables with high loadings on a factor are grouped together as they represent the same underlying construct.
4. Communalities
- The Communalities table shows the proportion of each variable’s variance explained by the factors. High communalities (close to 1) suggest that the variable is well explained by the factors, while low communalities indicate that the variable may not fit well into the factor structure.
Reporting the Results of Exploratory Factor Analysis
When reporting the results of EFA in your research or assignment, be sure to include the following elements:
- Methodology: Briefly explain the method used (e.g., Principal Component Analysis or Principal Axis Factoring), the number of factors extracted, and the rotation method applied.
- KMO and Bartlett’s Test Results: Report the KMO value and the significance of Bartlett’s test.
- Factor Structure: Discuss the number of factors retained, the variance explained by each factor, and the factor loadings.
- Interpretation of Factors: Provide a meaningful interpretation of the factors based on the variables that load on each factor. This involves naming the factors based on the items that most strongly correlate with them.
- Limitations: Acknowledge any limitations in the analysis, such as the sample size, the choice of rotation method, or the validity of the factor structure.

Conclusion
Exploratory Factor Analysis is a robust statistical method that helps in understanding the underlying structure of your data by identifying patterns of correlation among variables. SPSS provides an intuitive and user-friendly interface for performing EFA, making it easier to explore and interpret the factors that explain the variance in your data. By following the steps outlined in this guide, you can successfully perform EFA in SPSS and report your findings with confidence.
For students and professionals who need additional help with running factor analysis or other advanced statistical techniques in SPSS, seeking expert assistance from reliable platforms like GetSPSSHelp.com can ensure that your analysis is accurate and results-driven. Whether you’re working on an academic project or a complex research study, expert help can save you time and guide you toward meaningful insights.
Needs help with similar assignment?
We are available 24x7 to deliver the best services and assignment ready within 3-4 hours? Order a custom-written, plagiarism-free paper
