How to Run Paired Sample T-Test in SPSS|2025
Discover how to run Paired Sample T-Test in SPSS with our step-by-step guide. Ideal for comparing related groups and analyzing paired data to draw meaningful conclusions.
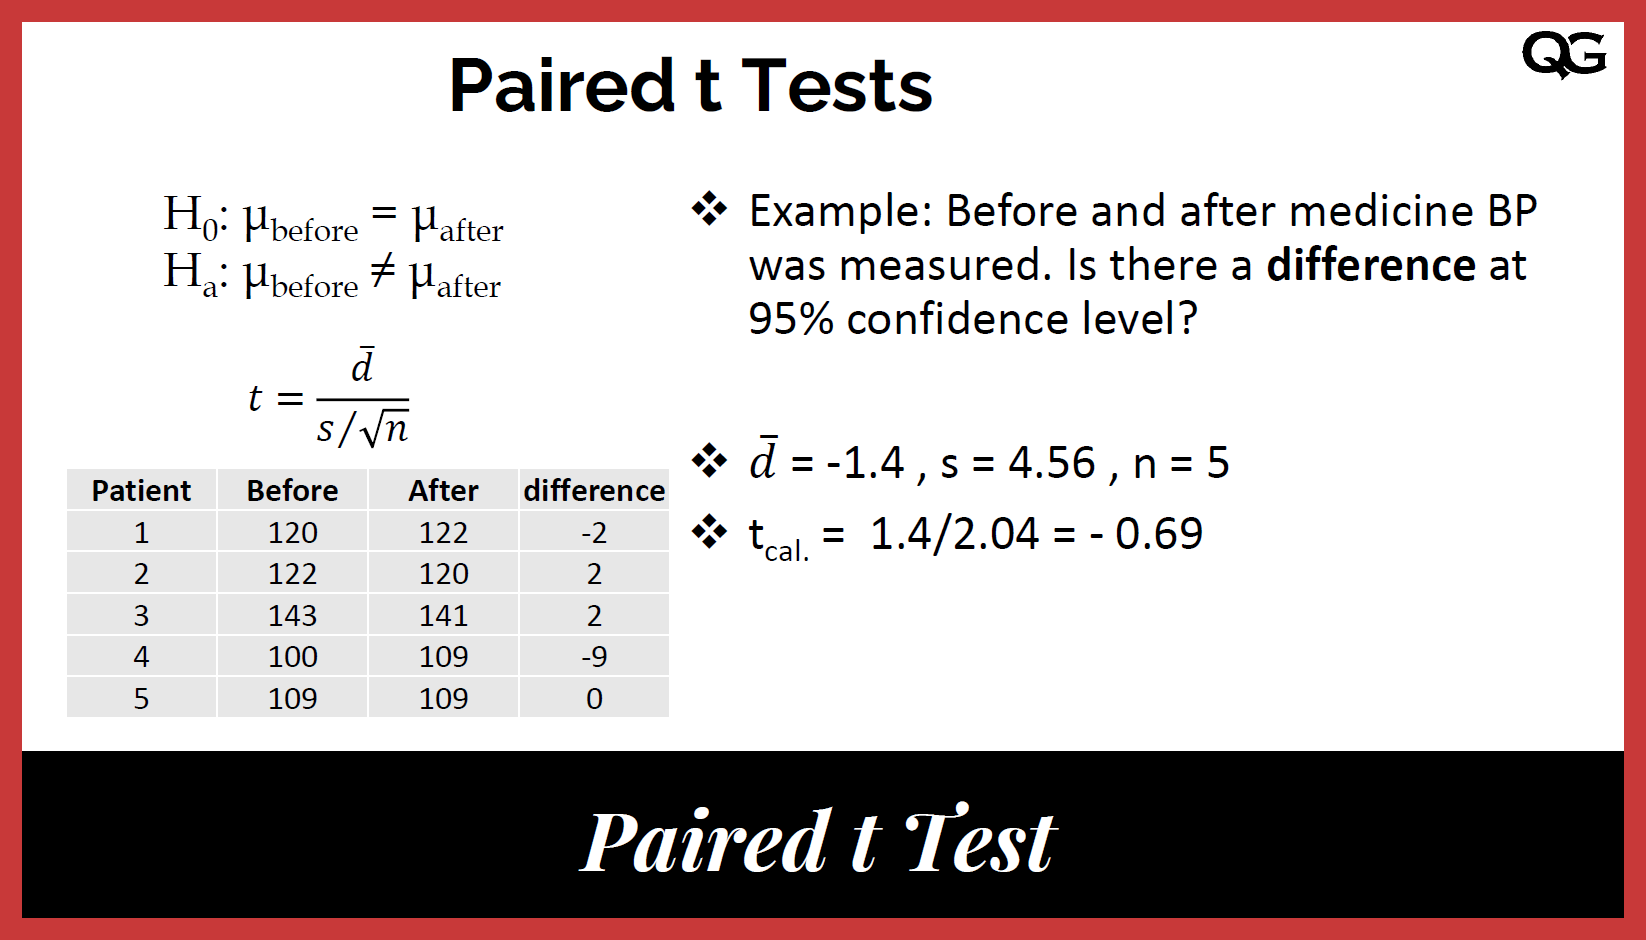
The paired sample t-test, also known as the dependent t-test, is a statistical method used to compare the means of two related groups. It is often applied in experimental research where measurements are taken before and after an intervention on the same subjects. This paper will provide a step-by-step guide on how to run a paired sample t-test in SPSS, interpret the results, and differentiate it from an independent sample t-test.
Understanding the Paired Sample T-Test
A paired sample t-test evaluates whether the mean difference between two related groups is significantly different from zero. Common scenarios where this test is applicable include:
- Pre-test and post-test scores of students
- Measuring blood pressure before and after medication
- Comparing employee performance before and after training
Assumptions of the Paired Sample T-Test
Before conducting a paired sample t-test, ensure that:
- The dependent variable is continuous (interval or ratio scale).
- The independent variable consists of two related groups.
- The differences between paired observations are approximately normally distributed.
- Observations are randomly selected.
How to Run Paired Sample T-Test in SPSS
Step 1: Load Your Data
- Open SPSS.
- Enter your data into two columns representing the paired variables (e.g., Pre-test scores and Post-test scores).
- Each row should correspond to a participant.
Step 2: Access the Paired Sample T-Test
- Click on Analyze > Compare Means > Paired-Samples T Test.
Step 3: Select the Paired Variables
- In the “Paired-Samples T-Test” dialog box, select the two related variables.
- Move them to the Paired Variables box.
Step 4: Run the Test
- Click OK to run the test.
- SPSS will generate an output window containing the test results.

Paired Sample T-Test SPSS Interpretation
SPSS provides several key tables in the output:
Paired Samples Statistics Table
- Displays the mean, sample size (N), standard deviation, and standard error mean for both groups.
Paired Samples Correlations Table
- Shows the correlation between the two related groups.
- A strong correlation indicates consistency in measurement.
Paired Samples Test Table
- Provides the mean difference, standard deviation, standard error, confidence intervals, t-value, degrees of freedom (df), and significance level (p-value).
- Interpretation:
- If p-value < 0.05, reject the null hypothesis (significant difference between the paired groups).
- If p-value > 0.05, fail to reject the null hypothesis (no significant difference).
Paired Sample T-Test Example
Example Scenario
A teacher wants to determine whether a new teaching method improves students’ test scores. The same students took a test before and after the method was implemented. The dataset contains:
- Pre-Test Score
- Post-Test Score
Running the paired sample t-test in SPSS reveals:
- Mean difference: 5.2
- t(29) = 3.45, p = 0.002
- Conclusion: Since p < 0.05, the new teaching method significantly improved test scores.
How to Run Paired Sample T-Test in SPSS PDF Export
To save results as a PDF:
- In the output window, click File > Export.
- Choose PDF format.
- Click OK to save.
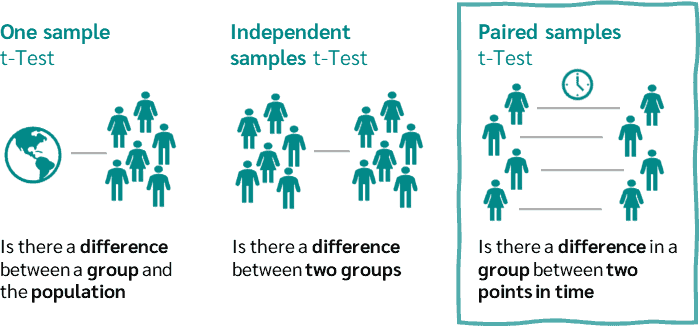
Independent Sample T-Test vs. Paired Sample T-Test
While a paired sample t-test compares two related groups, an independent sample t-test compares two separate groups (e.g., experimental vs. control group).
How to Run Independent Sample T-Test in SPSS
- Click Analyze > Compare Means > Independent-Samples T Test.
- Select the dependent variable.
- Assign the independent variable to define groups.
- Click OK to run the test.
Independent Sample T-Test SPSS Interpretation
SPSS generates tables similar to the paired t-test, but it includes Levene’s Test for Equality of Variances to check variance homogeneity.
Conclusion
The paired sample t-test in SPSS is a powerful tool for comparing two related means. Following the steps outlined, researchers can efficiently analyze data, interpret results, and make data-driven decisions. The test is particularly useful in pre-test/post-test scenarios and within-subject studies.
Needs help with similar assignment?
We are available 24x7 to deliver the best services and assignment ready within 3-4 hours? Order a custom-written, plagiarism-free paper
