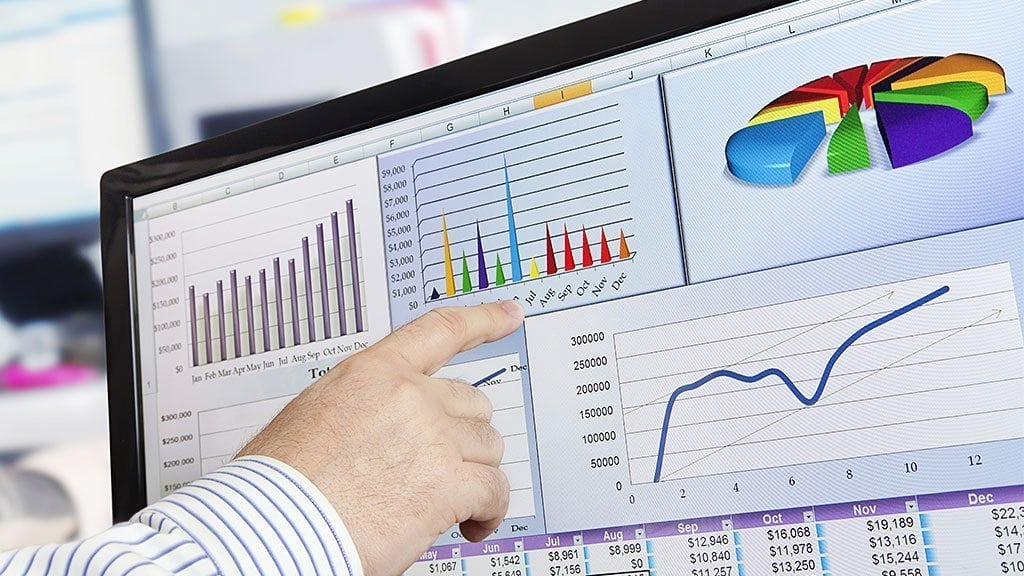
How to Use SAGE 50 for Financial Reporting and Analysis|2025
Learn how to use SAGE 50 for financial reporting and analysis, leveraging its tools to generate accurate reports, gain insights, and make informed business decisions.
SAGE 50 is one of the most widely used accounting software solutions for small and medium-sized enterprises (SMEs). It provides robust financial reporting and analysis tools that enable businesses to manage their accounts efficiently. This paper explores how to use SAGE 50 for financial reporting and analysis, covering key functionalities, report generation, customization, and interpretation of financial statements.
Understanding SAGE 50 Financial Reporting
SAGE 50 provides an array of built-in financial reports that help businesses track performance, manage cash flow, and comply with tax regulations. These reports include the balance sheet, income statement, cash flow statement, trial balance, and more.
Key Financial Reports in SAGE 50
- Balance Sheet – Provides a snapshot of a company’s financial position, showing assets, liabilities, and equity.
- Income Statement (Profit & Loss Statement) – Displays revenues, expenses, and net profit/loss over a specific period.
- Cash Flow Statement – Highlights cash inflows and outflows, assisting in liquidity management.
- Trial Balance – Ensures that debits and credits are balanced before financial statements are finalized.
- Aged Debtors and Creditors Reports – Show outstanding receivables and payables to manage cash flow efficiently.
- General Ledger Report – Provides a detailed view of all transactions recorded in various accounts.
Setting Up Financial Reporting in SAGE 50
Before generating financial reports, businesses must ensure that their accounting records are properly set up. The following steps outline how to configure SAGE 50 for accurate reporting:
Setting Up Company Information
- Navigate to Setup > Company Information and enter the company’s details such as name, address, fiscal year, and tax settings.
Configuring the Chart of Accounts
- Go to Chart of Accounts under the General Ledger module.
- Customize account categories (assets, liabilities, equity, revenue, and expenses) to align with business needs.
Defining Accounting Periods
- In Setup > Accounting Periods, specify the start and end dates for financial periods.
- Ensure that previous periods are closed to prevent unauthorized modifications.
Entering Opening Balances
- Input opening balances for accounts under General Ledger > Opening Balances.
- Verify the accuracy of the trial balance before proceeding with transactions.
Generating Financial Reports in SAGE 50
Accessing the Report Center
- Open Reports & Forms > Report Center to browse available reports.
- Select the desired financial report from categorized sections such as Financials, Customers, Vendors, and Employees.
Generating Standard Reports
- Choose the required report (e.g., Income Statement).
- Select the reporting period (month, quarter, year-to-date, or custom range).
- Click Run Report to generate the financial statement.
Customizing Reports
SAGE 50 allows customization of reports to meet specific business needs.
- Click Modify Report to adjust columns, filters, and date ranges.
- Apply departmental or project-based filters to analyze segment performance.
- Save customized templates for future use by selecting Save Report Settings.
Exporting Reports
- Reports can be exported in various formats, including PDF, Excel, and CSV.
- Click Export and choose the desired format to facilitate further analysis or sharing.
Analyzing Financial Reports in SAGE 50
Interpreting the Balance Sheet
- Current Assets vs. Current Liabilities: Ensure that short-term assets cover short-term liabilities to maintain liquidity.
- Equity Position: A growing equity balance indicates financial stability and profitability.
Understanding the Income Statement
- Revenue Trends: Compare current and previous period revenues to identify growth patterns.
- Expense Breakdown: Analyze expenses by category to identify cost-cutting opportunities.
- Profit Margins: Calculate gross and net profit margins to assess business efficiency.
Assessing Cash Flow Performance
- Operating Cash Flow: Positive cash flow from operations indicates a healthy business.
- Investment and Financing Activities: Review cash flows from asset purchases or loan repayments.
Reviewing Trial Balance for Errors
- Identify Unbalanced Accounts: Ensure all debit and credit entries are properly recorded.
- Adjust Journal Entries: Correct any discrepancies before finalizing reports.
Advanced Financial Analysis with SAGE 50
Budgeting and Forecasting
- Use Budgets under the General Ledger module to set financial targets.
- Compare actual performance against budgeted figures to measure financial discipline.
Ratio Analysis
- Calculate key financial ratios directly in SAGE 50:
- Current Ratio: Current Assets / Current Liabilities
- Debt-to-Equity Ratio: Total Liabilities / Shareholder’s Equity
- Net Profit Margin: Net Profit / Revenue
Comparative Reporting
- Generate reports for multiple periods to analyze trends.
- Use year-over-year comparisons to assess business growth.
Segment and Departmental Analysis
- Filter reports by department or cost center to track performance.
- Allocate expenses and revenues accurately for departmental budgeting.
Automating Financial Reporting in SAGE 50
Scheduling Reports
- Set up Automated Reports under Report Center to generate reports periodically.
- Schedule monthly or quarterly financial statements for management review.
Integrating with External Tools
- Link SAGE 50 with Excel or Power BI for advanced data visualization.
- Export financial data for deeper statistical analysis.
Using Dashboards for Real-Time Insights
- Customize SAGE 50 dashboards to display key financial metrics.
- Monitor cash flow, revenue, and expense trends in real time.
Compliance and Audit Preparedness
Ensuring Tax Compliance
- Generate VAT, GST, or Sales Tax Reports for tax filings.
- Use tax summary reports to reconcile tax payments.
Audit Trail and Internal Controls
- Enable Audit Trail Reports to track all accounting transactions.
- Implement role-based access to restrict unauthorized changes.
Conclusion
SAGE 50 provides a comprehensive suite of financial reporting and analysis tools essential for business decision-making. By leveraging its reporting features, businesses can gain valuable insights into their financial health, optimize operations, and ensure regulatory compliance. Proper setup, customization, and analysis of reports allow organizations to maximize the benefits of using SAGE 50 for financial management.
Needs help with similar assignment?
We are available 24x7 to deliver the best services and assignment ready within 3-4 hours? Order a custom-written, plagiarism-free paper


