Interpreting SPSS Output: A Comprehensive Guide|2025
Interpreting SPSS Output: A Comprehensive Guide provides step-by-step instructions on how to analyze and understand SPSS results. Master key concepts and improve your data interpretation skills for accurate research findings.
Statistical Package for the Social Sciences (SPSS) is a powerful tool for data analysis that provides researchers with a wealth of information. However, interpreting SPSS output can be challenging for those unfamiliar with its layout and terminology. This paper provides an in-depth guide to interpreting SPSS output, with examples and insights into its application in research. Topics covered include regression analysis, descriptive statistics, and the use of SPSS in various research scenarios. Additionally, references to PDFs and online resources are provided for further understanding.

Importance of Interpreting SPSS Output in Research
SPSS is widely used in academic, social, and business research. The ability to interpret SPSS output effectively is crucial for:
- Understanding Research Results: SPSS output helps researchers derive meaningful insights from raw data.
- Supporting Decision-Making: In business, SPSS analyses can guide strategic decisions.
- Ensuring Accurate Reporting: Proper interpretation ensures accurate representation of findings in publications.
Components of SPSS Output
SPSS generates various tables and charts as part of its output. Below are key components commonly encountered in SPSS analyses:
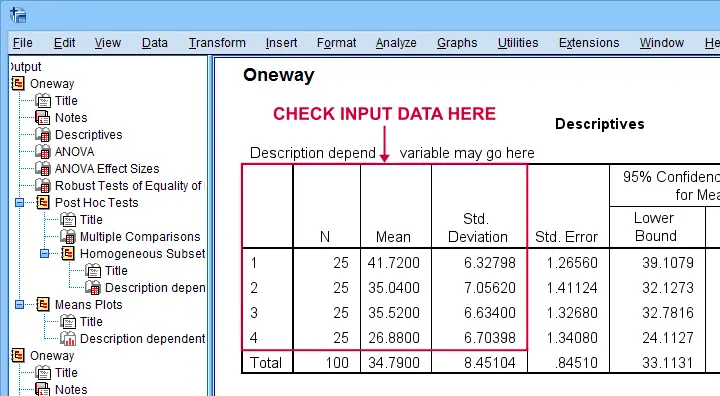
Descriptive Statistics
Descriptive statistics provide a summary of the dataset, including measures like mean, median, standard deviation, and range. Here’s how to interpret these elements:
- Mean: The average value of the dataset.
- Standard Deviation: Indicates the spread of data around the mean. A smaller standard deviation suggests less variability.
- Range: The difference between the maximum and minimum values.
Example: A table showing descriptive statistics might display the mean income of respondents as $50,000, with a standard deviation of $10,000, indicating moderate variability.
Frequency Tables
Frequency tables summarize categorical data, showing the count and percentage of each category.
Example: A frequency table for gender might display:
| Gender | Frequency | Percentage |
|---|---|---|
| Male | 150 | 60% |
| Female | 100 | 40% |
Cross-Tabulation
Cross-tabulation tables examine relationships between two categorical variables. The chi-square statistic often accompanies these tables to test for significance.
Example: A cross-tabulation might reveal the relationship between gender and preference for a product, with a chi-square value indicating whether the association is statistically significant.
How to Interpret Regression Results in SPSS
Regression analysis is one of the most commonly used statistical methods in SPSS. Understanding how to interpret regression output is critical for explaining relationships between variables.
Key Elements of Regression Output
Model Summary Table
-
- R: Correlation coefficient indicating the strength of the relationship.
- R Square: Proportion of variance in the dependent variable explained by the independent variables.
- Adjusted R Square: Adjusted for the number of predictors; more reliable for small samples.
Example: An R Square value of 0.65 suggests that 65% of the variance in the dependent variable is explained by the model.
ANOVA Table
-
- Tests the overall significance of the model.
- The F-statistic and its p-value indicate whether the model significantly predicts the dependent variable.
Example: An F-statistic of 12.34 with a p-value of 0.001 implies the model is significant.
Coefficients Table
-
- Provides estimates for each predictor variable.
- Unstandardized Coefficients (B): Show the effect of each predictor in its original units.
- Standardized Coefficients (Beta): Allow comparison of the relative importance of predictors.
- p-value: Indicates whether the predictor is statistically significant.
Example: If the unstandardized coefficient for education level is 0.5 and its p-value is 0.03, a one-unit increase in education level is associated with a 0.5-unit increase in income, assuming other variables are constant.
Multiple Regression SPSS Output Interpretation
Multiple regression involves more than one independent variable. The interpretation process is similar but focuses on:
- Multicollinearity: Ensure predictors are not highly correlated (check Variance Inflation Factor, VIF).
- Interaction Terms: Investigate if predictors interact to affect the dependent variable.
Example: A multiple regression model predicting job satisfaction might include predictors like salary, work environment, and tenure, with coefficients showing their individual contributions.
SPSS Analysis and Interpretation in Research
SPSS output is central to presenting research findings. Below are some key areas where SPSS analysis is commonly applied:
Survey Analysis
Survey data often involve frequencies, descriptive statistics, and cross-tabulations. Interpreting these outputs ensures that trends and patterns are accurately reported.
Example: Analyzing a survey on consumer preferences might involve comparing mean satisfaction scores across different demographics.
Experimental Research
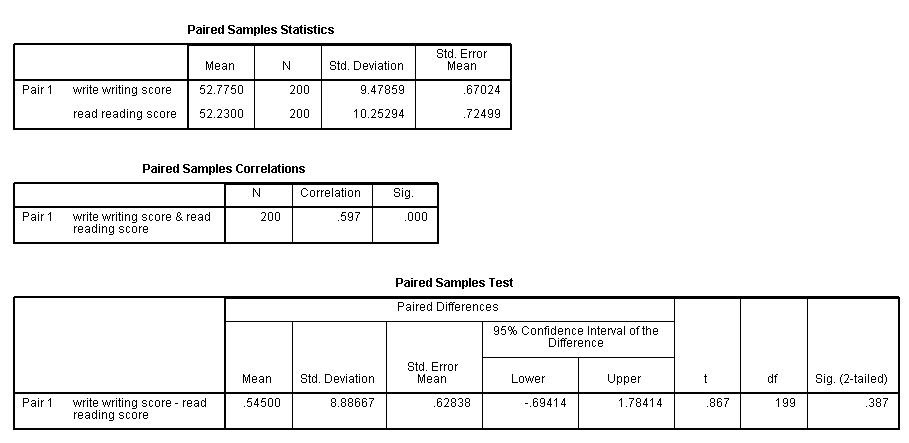
SPSS output in experiments often includes ANOVA or t-tests to compare group means.
Example: A study comparing test scores across teaching methods might use SPSS to determine if differences are statistically significant.
Predictive Modeling
Regression analysis in SPSS helps predict outcomes based on independent variables.
Example: Predicting employee turnover based on factors like workload and job satisfaction.
Online Resources and PDFs for SPSS Output Interpretation
Numerous online resources and downloadable PDFs are available to aid in understanding SPSS output. These include tutorials, guides, and examples:
- Interpreting SPSS Output PDF: Comprehensive documents that explain each component of SPSS output.
- Example: A downloadable guide detailing how to interpret regression and ANOVA results.
- Interpreting SPSS Output Example: Online examples of SPSS outputs with step-by-step interpretations.
- Example: A blog post demonstrating how to interpret cross-tabulation results.
- SPSS Output Interpretation Online: Websites offering interactive tools and forums for discussing SPSS output.
- Example: Communities like ResearchGate where researchers share insights.
- SPSS Analysis and Interpretation PDF: Step-by-step instructions for conducting and interpreting specific analyses.
- Example: A tutorial on logistic regression available as a PDF.
Common Challenges in Interpreting SPSS Output
Despite its user-friendly interface, interpreting SPSS output can be daunting. Below are some common challenges and tips to overcome them:
Misinterpreting Significance
- Challenge: Confusing statistical significance with practical significance.
- Solution: Always consider effect sizes alongside p-values.
Overlooking Assumptions
- Challenge: Ignoring assumptions like normality or homoscedasticity.
- Solution: Use diagnostic tests (e.g., residual plots) to validate assumptions.
Complex Output
- Challenge: Large datasets generate extensive output, making it hard to focus.
- Solution: Filter output to show only relevant tables and charts.
Conclusion
Interpreting SPSS output is a vital skill for researchers across disciplines. By understanding descriptive statistics, regression results, and other key components, researchers can derive meaningful insights and support their findings. Resources such as online tutorials and PDFs provide valuable support for mastering SPSS interpretation. Whether analyzing survey data or conducting predictive modeling, a systematic approach ensures accurate and impactful results.
Needs help with similar assignment?
We are available 24x7 to deliver the best services and assignment ready within 3-4 hours? Order a custom-written, plagiarism-free paper
