Pearson Correlation Coefficient for Dummies: How to Understand the Statistic|2025
/in General Articles /by BesttutorLearn Pearson Correlation Coefficient for dummies. Discover an easy-to-understand guide on calculating and interpreting the relationship between two variables in your data analysis.
In the world of statistics, there are various methods and tools available to analyze relationships between variables. One of the most common and widely used methods is the Pearson Correlation Coefficient (denoted as r), which measures the strength and direction of a linear relationship between two variables. Understanding this statistic is crucial for anyone working with data, as it can reveal important insights about the connections between different data points.
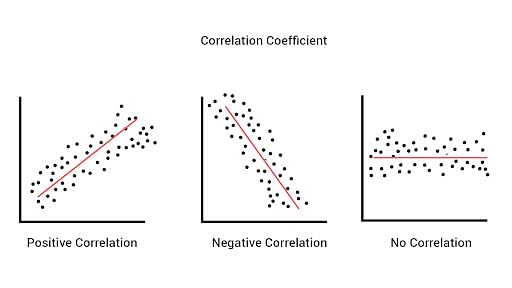
Table of Contents
ToggleWhat is the Pearson Correlation Coefficient?
The Pearson correlation coefficient, often referred to simply as Pearson’s r, is a measure that evaluates the degree to which two variables are linearly related. It is a value that ranges between -1 and 1, where:
- r = 1 indicates a perfect positive linear relationship.
- r = -1 indicates a perfect negative linear relationship.
- r = 0 indicates no linear relationship between the two variables.
In simpler terms, Pearson’s r tells you how well two variables move in relation to one another. When the value of r is close to 1 or -1, it means there is a strong relationship. When r is close to 0, it indicates a weak or no relationship.
The Importance of Understanding Pearson’s r
Understanding how to interpret Pearson’s r is essential, especially for researchers, data analysts, and anyone who works with quantitative data. This statistic helps determine the strength and direction of the relationship between variables, enabling decision-makers to assess whether two variables are positively or negatively correlated and how strong that correlation might be.
For example, a positive Pearson correlation between height and weight suggests that as height increases, weight tends to increase as well, while a negative correlation between temperature and heating costs would suggest that as temperature increases, heating costs decrease.
Pearson Correlation Coefficient Formula
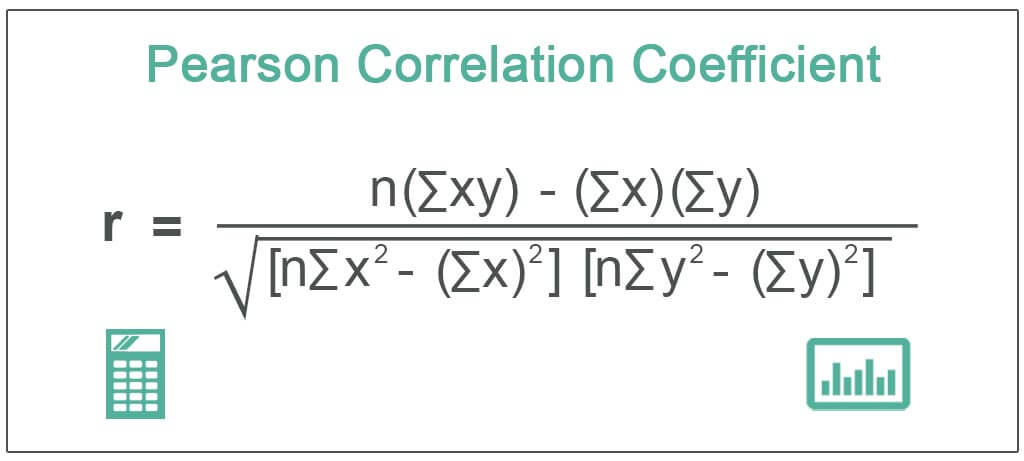
The Pearson correlation coefficient is calculated using the following formula:
r=n(∑xy)−(∑x)(∑y)[n∑x2−(∑x)2][n∑y2−(∑y)2]r = \frac{n(\sum xy) – (\sum x)(\sum y)}{\sqrt{[n \sum x^2 – (\sum x)^2][n \sum y^2 – (\sum y)^2]}}r=[n∑x2−(∑x)2][n∑y2−(∑y)2]n(∑xy)−(∑x)(∑y)Where:
- r = Pearson correlation coefficient
- n = number of data points
- Σxy = sum of the product of paired scores
- Σx = sum of the x-values (independent variable)
- Σy = sum of the y-values (dependent variable)
- Σx² = sum of the squared x-values
- Σy² = sum of the squared y-values
This formula may look intimidating at first glance, but it can be broken down into manageable parts. Let’s take a look at how we would apply this formula with an example problem to make things clearer.
How to Calculate Pearson Correlation Coefficient: Example Problems with Solutions
Example 1: Pearson Correlation Calculation
Let’s calculate the Pearson correlation coefficient between two variables: hours studied and test scores. Here is the data for five students:
| Student | Hours Studied (X) | Test Score (Y) |
|---|---|---|
| 1 | 2 | 60 |
| 2 | 3 | 65 |
| 3 | 5 | 80 |
| 4 | 6 | 85 |
| 5 | 8 | 90 |
Step 1: Calculate the necessary sums
First, calculate the sums of the individual values and products as required by the formula.
∑x=2+3+5+6+8=24\sum x = 2 + 3 + 5 + 6 + 8 = 24∑x=2+3+5+6+8=24 ∑y=60+65+80+85+90=380\sum y = 60 + 65 + 80 + 85 + 90 = 380∑y=60+65+80+85+90=380 ∑x2=22+32+52+62+82=4+9+25+36+64=138\sum x^2 = 2^2 + 3^2 + 5^2 + 6^2 + 8^2 = 4 + 9 + 25 + 36 + 64 = 138∑x2=22+32+52+62+82=4+9+25+36+64=138 ∑y2=602+652+802+852+902=3600+4225+6400+7225+8100=34150\sum y^2 = 60^2 + 65^2 + 80^2 + 85^2 + 90^2 = 3600 + 4225 + 6400 + 7225 + 8100 = 34150∑y2=602+652+802+852+902=3600+4225+6400+7225+8100=34150 ∑xy=(2×60)+(3×65)+(5×80)+(6×85)+(8×90)=120+195+400+510+720=1945\sum xy = (2 \times 60) + (3 \times 65) + (5 \times 80) + (6 \times 85) + (8 \times 90) = 120 + 195 + 400 + 510 + 720 = 1945∑xy=(2×60)+(3×65)+(5×80)+(6×85)+(8×90)=120+195+400+510+720=1945
Step 2: Apply the values to the Pearson formula
Now, substitute these sums into the Pearson correlation coefficient formula:
r=5(1945)−(24)(380)[5(138)−(24)2][5(34150)−(380)2]r = \frac{5(1945) – (24)(380)}{\sqrt{[5(138) – (24)^2][5(34150) – (380)^2]}}r=[5(138)−(24)2][5(34150)−(380)2]5(1945)−(24)(380) r=9725−9120[690−576][170750−144400]r = \frac{9725 – 9120}{\sqrt{[690 – 576][170750 – 144400]}}r=[690−576][170750−144400]9725−9120 r=605114×26350r = \frac{605}{\sqrt{114 \times 26350}}r=114×26350605 r=6053009900=6051735.68≈0.349r = \frac{605}{\sqrt{3009900}} = \frac{605}{1735.68} \approx 0.349r=3009900605=1735.68605≈0.349Thus, the Pearson correlation coefficient between hours studied and test scores is approximately 0.349. This indicates a moderate positive relationship between the two variables—suggesting that, as the number of hours studied increases, the test score also tends to increase.
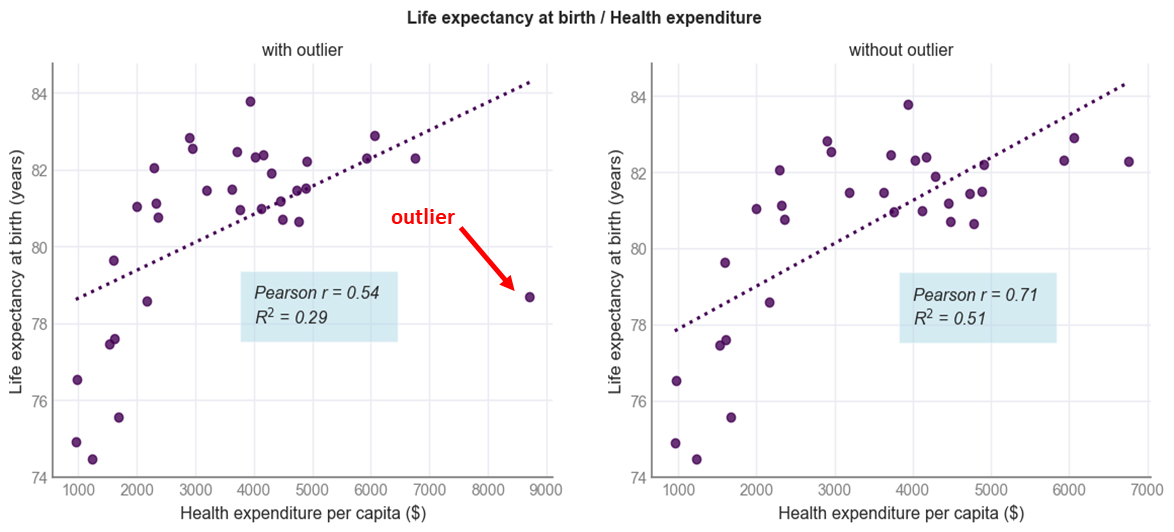
What Does r-Squared Stand for in Statistics?
r-squared (r²) is another statistic that is closely related to the Pearson correlation coefficient. While Pearson’s r indicates the strength and direction of a linear relationship, r² gives us the proportion of the variance in the dependent variable that is predictable from the independent variable. Essentially, r² measures the “goodness of fit” of a regression model.
For example, if r = 0.5, then r² = 0.25, meaning that 25% of the variation in the dependent variable can be explained by the independent variable. The higher the r² value, the better the model fits the data.
Pearson Correlation Coefficient in Excel
Calculating the Pearson correlation coefficient can be done easily in Excel without needing to use the lengthy formula. Here’s how to do it:
- Enter your data into two columns in Excel (e.g., one column for X and one for Y).
- Use the following function in a new cell to calculate the correlation coefficient:
=PEARSON(range1,range2)=PEARSON(range1, range2)=PEARSON(range1,range2)Where range1 is the data for the first variable (X) and range2 is the data for the second variable (Y).
For the above data (hours studied and test scores), the formula in Excel would be:
=PEARSON(A2:A6,B2:B6)=PEARSON(A2:A6, B2:B6)=PEARSON(A2:A6,B2:B6)This will return the Pearson correlation coefficient, which should match the result we calculated manually.
Pearson Correlation Coefficient Interpretation in SPSS
In SPSS, you can easily calculate the Pearson correlation coefficient using the following steps:
- Input your data into two separate columns in SPSS.
- Click on Analyze → Correlate → Bivariate.
- Select the two variables you want to analyze.
- Click OK.
SPSS will then display the Pearson correlation coefficient, along with significance values (p-values), in a correlation matrix. A significant correlation is typically considered when the p-value is less than 0.05.
Pearson Correlation Interpretation
The interpretation of Pearson’s r is as follows:
- 0.0 to 0.1: Very weak or no correlation
- 0.1 to 0.3: Weak positive correlation
- 0.3 to 0.5: Moderate positive correlation
- 0.5 to 0.7: Strong positive correlation
- 0.7 to 1.0: Very strong positive correlation
- -0.1 to -0.3: Weak negative correlation
- -0.3 to -0.5: Moderate negative correlation
- -0.5 to -0.7: Strong negative correlation
- -0.7 to -1.0: Very strong negative correlation
In general, if r > 0, there is a positive relationship between the variables, while if r < 0, there is a negative relationship. The closer r is to 1 or -1, the stronger the relationship.
Pearson Correlation Coefficient Formula Copy and Paste
For those who prefer a quick copy-paste formula, here it is:
r=n(∑xy)−(∑x)(∑y)[n∑x2−(∑x)2][n∑y2−(∑y)2]r = \frac{n(\sum xy) – (\sum x)(\sum y)}{\sqrt{[n \sum x^2 – (\sum x)^2][n \sum y^2 – (\sum y)^2]}}r=[n∑x2−(∑x)2][n∑y2−(∑y)2]n(∑xy)−(∑x)(∑y)Feel free to use it for your own calculations, or implement it in Excel or SPSS!
Conclusion
The Pearson Correlation Coefficient is an invaluable tool in statistics for understanding the linear relationships between variables. By calculating and interpreting r, we can gain insights into how two variables are related, whether positively or negatively, and how strong that relationship is. It can be easily calculated using Excel, SPSS, or even manually with the Pearson correlation coefficient formula. Understanding r and r-squared provides a foundation for many statistical analyses, such as regression analysis, hypothesis testing, and prediction modeling.
When interpreting r, remember that a strong correlation does not imply causation. Correlation only measures the strength of the relationship between two variables, not whether one variable causes the other to change. Therefore, while Pearson’s r can tell us important things about our data, further analysis and research are often necessary to draw conclusions about cause and effect.
Needs help with similar assignment?
We are available 24x7 to deliver the best services and assignment ready within 3-4 hours? Order a custom-written, plagiarism-free paper
