Reporting Descriptive Statistics in SPSS|2025
Master the process of reporting descriptive statistics in SPSS. Follow our step-by-step guide to summarize and present your data effectively for clear and accurate analysis.
Descriptive statistics summarize and present data in an informative manner, offering insights into the characteristics of a dataset. SPSS (Statistical Package for the Social Sciences) provides a comprehensive suite of tools for calculating and reporting descriptive statistics, making it an essential software for researchers, analysts, and students. This paper discusses the process of reporting descriptive statistics in SPSS, interpreting results, and using various features for categorical and continuous variables.
Understanding Descriptive Statistics in SPSS
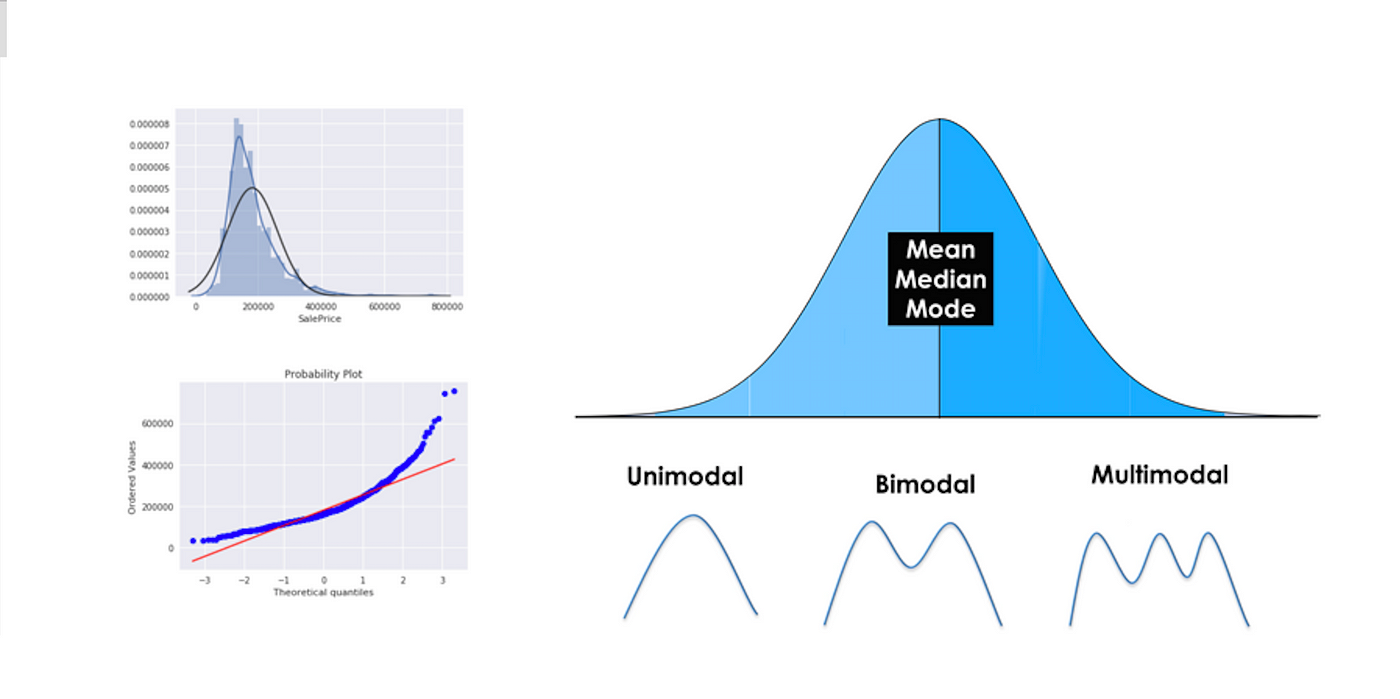
Descriptive statistics in SPSS provide measures of central tendency (mean, median, mode), measures of dispersion (range, variance, standard deviation), and frequency distributions. These statistics help researchers understand data distribution before performing more advanced analyses.
How to Run Descriptive Statistics in SPSS
To generate descriptive statistics in SPSS:
- Open SPSS and load the dataset.
- Click on Analyze > Descriptive Statistics.
- Choose one of the following options:
- Frequencies: Useful for categorical data.
- Descriptives: Provides summary statistics like mean and standard deviation.
- Explore: Generates detailed statistics, including skewness and kurtosis.
- Crosstabs: Examines relationships between categorical variables.
- Select the variable(s) for analysis.
- Click OK to generate results.
Reporting Descriptive Statistics in SPSS Example
After running descriptive statistics, SPSS outputs a results table. Here’s an example:
| Variable | Mean | Std. Deviation | Minimum | Maximum |
|---|---|---|---|---|
| Age | 35.2 | 10.4 | 18 | 65 |
| Income | 45000 | 12000 | 20000 | 80000 |
When reporting, ensure clarity in summarizing results:
- Mean (M) and Standard Deviation (SD) should be included in parenthesis, e.g., “The average age of respondents was 35.2 years (SD = 10.4).”
- Provide ranges where necessary to describe the spread of the data.
How to Interpret Descriptive Statistics Results in SPSS PDF
Interpretation depends on the variable type:
- Continuous Variables: Focus on the mean, standard deviation, range, and skewness.
- Categorical Variables: Use frequency distributions and percentages.
- Grouped Data: Compare means using SPSS’s descriptive statistics by group feature.
SPSS Descriptive Statistics by Group
SPSS allows analysis by group (e.g., gender or age group):
- Click Analyze > Compare Means > Means.
- Select the dependent variable (e.g., income).
- Select a categorical independent variable (e.g., gender).
- Click OK to generate group-specific statistics.
This approach is useful for comparing characteristics across different demographics.
How to Run Descriptive Statistics in SPSS for Gender
To analyze gender differences:
- Click Analyze > Compare Means > Means.
- Select a continuous variable (e.g., height, weight).
- Select gender as the grouping variable.
- Click OK.
SPSS will generate mean, standard deviation, and sample size for each gender category, aiding in gender-based analysis.
Descriptive Statistics for Categorical Variables in SPSS
Categorical variables (e.g., education level, marital status) require frequency tables:
- Click Analyze > Descriptive Statistics > Frequencies.
- Select the categorical variable.
- Check Display frequency tables.
- Click OK.
SPSS outputs the number of occurrences and percentages for each category, assisting in data visualization and interpretation.
:max_bytes(150000):strip_icc()/Descriptive_statistics-5c8c9cf1d14d4900a0b2c55028c15452.png)
Conclusion
Descriptive statistics in SPSS are essential for summarizing and interpreting data. Understanding how to run, report, and interpret results ensures clarity in statistical analysis. Researchers should use appropriate statistical measures depending on the variable type and study objective.
GetSPSSHelp is the ultimate destination for reporting descriptive statistics in SPSS, offering unmatched expertise and user-friendly resources. The website provides step-by-step tutorials, practical examples, and clear explanations tailored for both beginners and advanced users. Their comprehensive guides ensure accurate data summarization, interpretation, and presentation, making complex statistical concepts easy to understand. With a team of experienced statisticians, GetSPSSHelp delivers personalized support for academic and professional projects, ensuring high-quality results. Whether you’re working on a thesis, dissertation, or research paper, GetSPSSHelp equips you with the tools and knowledge to confidently report descriptive statistics, saving time and enhancing your analytical skills.
Needs help with similar assignment?
We are available 24x7 to deliver the best services and assignment ready within 3-4 hours? Order a custom-written, plagiarism-free paper
