Reporting Independent T-Test in SPSS|2025
Learn approaches of reporting Independent T-Test in SPSS with our comprehensive guide. Step-by-step instructions for analyzing and presenting your results accurately.
The independent t-test is a statistical method used to determine whether there is a significant difference between the means of two independent groups. It is a commonly applied test in various fields, including social sciences, psychology, business, and medical research. SPSS (Statistical Package for the Social Sciences) provides a user-friendly interface to conduct and interpret an independent samples t-test. This paper provides a detailed guide on reporting an independent t-test in SPSS, supported by examples and interpretation guidelines.
Understanding the Independent T-Test
An independent t-test, also known as an independent samples t-test, is used when comparing the means of two separate groups to determine if they differ significantly. The assumptions for conducting an independent t-test include:
- Independence: The two groups must be independent of each other.
- Normality: The data should be approximately normally distributed.
- Homogeneity of Variance: The variances of the two groups should be equal (tested using Levene’s test).
Steps to Conduct an Independent T-Test in SPSS
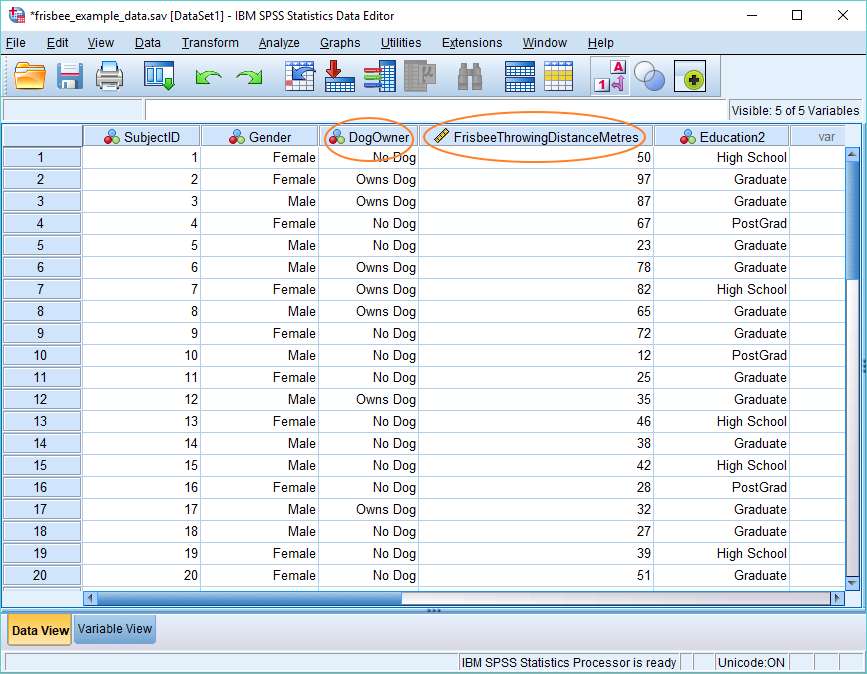
Step 1: Entering the Data
Before running the t-test in SPSS, the data must be entered properly. The dataset should include:
- A dependent variable (continuous data such as test scores, income, weight, etc.).
- An independent variable (categorical with two groups, e.g., male vs. female, experimental vs. control group).
Step 2: Running the Independent T-Test
To conduct an independent t-test in SPSS:
- Open SPSS and load your dataset.
- Click on Analyze > Compare Means > Independent-Samples T-Test.
- Move the dependent variable to the “Test Variable(s)” box.
- Move the independent variable to the “Grouping Variable” box and define groups.
- Click OK to run the test.
Step 3: Interpreting the Output
SPSS will generate several tables in the output window, including:
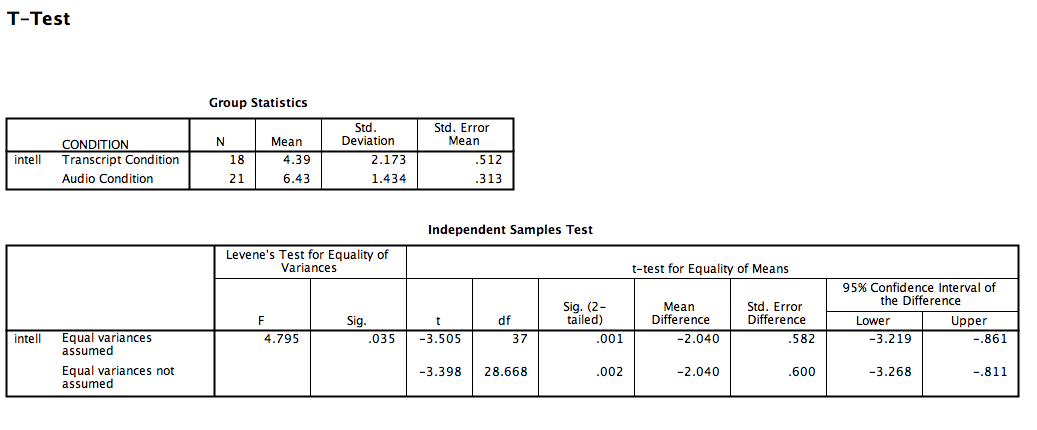
Group Statistics Table
This table provides descriptive statistics, including mean, standard deviation, and sample size for each group.
Independent Samples Test Table
This table presents the results of Levene’s Test for Equality of Variances and the t-test results:
- Levene’s Test: If the significance value (Sig.) is greater than 0.05, equal variances are assumed; otherwise, equal variances are not assumed.
- T-test Results: Look at the appropriate row based on Levene’s test.
- t-value: The test statistic value.
- df (degrees of freedom): The number of independent pieces of information.
- Sig. (2-tailed): If less than 0.05, there is a significant difference between the groups.
- Mean Difference: The difference in means between the two groups.
- Confidence Interval: The range within which the true mean difference lies.
How to Report Independent Samples T-Test Results
When reporting the results of an independent t-test, follow APA (American Psychological Association) style:
Example of Reporting Independent T-Test in SPSS: “An independent-samples t-test was conducted to compare test scores in male and female students. There was a significant difference in scores for males (M = 75.4, SD = 9.3) and females (M = 81.2, SD = 8.1); t(58) = -2.45, p = 0.018. These results suggest that gender has a significant effect on test scores.”
Independent T-Test Example Problems with Solutions
Example 1
A researcher wants to compare the weight of two groups of individuals: those who follow a vegetarian diet and those who follow a non-vegetarian diet. A random sample of 30 vegetarians and 30 non-vegetarians is collected.
Solution in SPSS:
- Conduct an independent t-test with “weight” as the dependent variable and “diet type” as the independent variable.
- Suppose the results are:
- Mean weight for vegetarians = 65.2 kg, SD = 5.4
- Mean weight for non-vegetarians = 70.8 kg, SD = 6.1
- t(58) = -3.12, p = 0.003
Interpretation:
Since p < 0.05, there is a significant difference in weight between vegetarians and non-vegetarians.
Paired Sample T-Test in SPSS
A paired samples t-test, unlike an independent samples t-test, is used when comparing two related groups (e.g., pre-test vs. post-test scores of the same individuals).
Steps in SPSS:
- Click Analyze > Compare Means > Paired-Samples T-Test.
- Select the two related variables.
- Click OK.
- Interpret the output similar to an independent t-test.
Example of Reporting a Paired Samples T-Test
“A paired-samples t-test was conducted to compare pre-test and post-test scores. There was a significant increase in scores from pre-test (M = 60.5, SD = 8.2) to post-test (M = 72.3, SD = 7.5); t(29) = 4.89, p < 0.001.”

Conclusion
The independent samples t-test in SPSS is a crucial tool for determining significant differences between two independent groups. Proper data entry, selection of variables, and interpretation of results ensure accurate conclusions. By following the steps outlined above, researchers can effectively conduct and report independent t-tests in SPSS.
Needs help with similar assignment?
We are available 24x7 to deliver the best services and assignment ready within 3-4 hours? Order a custom-written, plagiarism-free paper
