Reporting One Sample T Test in SPSS Help: A Comprehensive Guide|2025
/in SPSS Articles /by BesttutorGet expert help with Reporting One Sample T Test in SPSS Help. Learn how to perform the test, interpret results, and report your findings accurately with step-by-step guidance and support.
The One-Sample T-Test is one of the most commonly used statistical tests in data analysis, particularly in the fields of psychology, education, healthcare, and social sciences. It is applied when comparing the mean of a sample to a known value or a population mean. This test is especially useful for evaluating whether a sample mean is significantly different from a population mean, or if a certain condition or benchmark is met. SPSS (Statistical Package for the Social Sciences) makes it easy to perform this test and interpret the results.
As terms such as “One-Sample T-Test in SPSS,” “SPSS T-test results interpretation,” and “how to report One-Sample T-Test SPSS” continue to gain traction in both Google and Bing searches, this article will provide an in-depth guide to performing and reporting the One-Sample T-Test in SPSS.
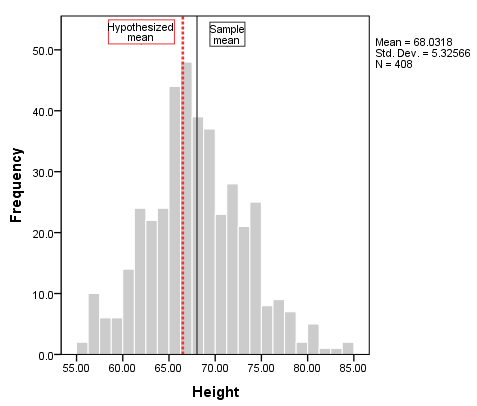
Table of Contents
ToggleWhat is a One-Sample T-Test?
A One-Sample T-Test is a statistical method used to compare the mean of a single sample to a known value (often a population mean) to determine if there is a statistically significant difference between the sample mean and the known value.
This test is particularly valuable when the data are continuous and approximately normally distributed. In situations where assumptions of normality are met, the One-Sample T-Test can determine whether the sample mean is different from a hypothesized value or population mean.
Mathematically, the test works by calculating a t-statistic, which measures how much the sample mean deviates from the known population mean in units of standard error. If this t-statistic is sufficiently large, it suggests that the difference between the sample mean and the population mean is statistically significant.
When to Use the One-Sample T-Test
The One-Sample T-Test is appropriate under the following conditions:
- Single sample comparison: The test is used when comparing the mean of one sample to a known value (e.g., population mean or expected value).
- Continuous data: The dependent variable should be continuous (interval or ratio level).
- Normality: The data should be approximately normally distributed. However, the One-Sample T-Test is robust to slight deviations from normality, especially if the sample size is large.
- Independent observations: Each observation in the sample should be independent of others.
Examples where the One-Sample T-Test might be applied include:
- Comparing the average test scores of a sample of students to a national average.
- Comparing a company’s monthly sales to a target value.
- Comparing the blood pressure of a sample of patients to a known population mean.
Assumptions of the One-Sample T-Test
While the One-Sample T-Test is a powerful tool, there are assumptions that must be met to ensure valid results:
- Normality of data: The distribution of the sample should be approximately normal. If the sample size is large (usually greater than 30), the test is less sensitive to deviations from normality due to the central limit theorem.
- Scale of measurement: The dependent variable must be measured at least on an interval scale (i.e., continuous data).
- Independence: Observations should be independent of each other, meaning that each data point does not influence others.
These assumptions are important because violations can lead to inaccurate results or conclusions.
Performing the One-Sample T-Test in SPSS
SPSS provides an intuitive interface for conducting the One-Sample T-Test. Below is a step-by-step guide to running the One-Sample T-Test using SPSS.
Step 1: Preparing Your Data
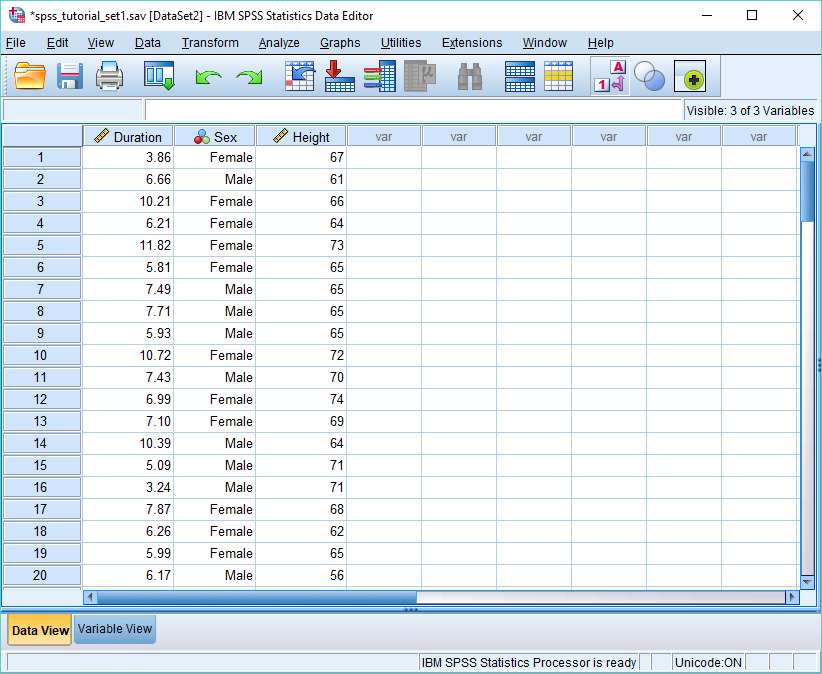
Before you conduct the One-Sample T-Test, ensure that your data are correctly entered into SPSS. The data should be in a single column, with each row representing one observation. The column will contain the values of the variable you are comparing to a known value (e.g., population mean or benchmark).
For example, if you are comparing the test scores of a group of students to a national average, you would enter the test scores in one column.
Step 2: Running the One-Sample T-Test
- Open SPSS: Launch SPSS and open your dataset.
- Navigate to Analyze → Compare Means → One-Sample T-Test: From the SPSS menu, select Analyze → Compare Means → One-Sample T-Test.
- Select Variables: In the dialog box that appears, select the variable that contains the data you want to compare and move it into the “Test Variable(s)” box.
- Define the Test Value: In the “Test Value” box, enter the population mean or known value that you want to compare the sample mean against. For example, if you are comparing the test scores of students to the national average, enter the national average value.
- Click OK: After specifying your test value, click OK to run the analysis.
Step 3: Interpreting the Output
Once the analysis is complete, SPSS will generate an output window with several tables. The key tables to examine when interpreting the One-Sample T-Test are:
- Descriptive Statistics Table: This table displays the basic statistics for the sample, including the sample size (N), mean, standard deviation, and standard error of the mean.Example:
- “N = 30, Mean = 85.2, Standard Deviation = 10.5, Standard Error = 1.9”
- One-Sample T-Test Table: This table contains the critical information for determining whether the difference between the sample mean and the population mean is statistically significant:
- T-Statistic: The t-value calculated by SPSS, which measures the difference between the sample mean and the population mean in terms of the standard error.
- Degrees of Freedom (df): The degrees of freedom for the test, which is equal to the sample size minus one (n – 1).
- Sig. (2-tailed): The p-value, which tells you whether the difference is statistically significant. If the p-value is less than 0.05 (alpha level), then the difference is statistically significant.
Example:
- “t(29) = 2.45, p = 0.02”
Reporting the Results of the One-Sample T-Test
When reporting the results of the One-Sample T-Test, it is important to include all necessary details to ensure transparency and clarity. Here is an example of how to report the results:
- Descriptive Statistics: Begin by reporting the descriptive statistics, including the sample size (N), mean, standard deviation, and standard error.Example:
- “The sample consisted of 30 students, with a mean test score of 85.2 (SD = 10.5).”
- T-Statistic and Degrees of Freedom: Report the t-statistic, degrees of freedom, and the associated p-value.Example:
- “A One-Sample T-Test was conducted to compare the test scores of students to the national average of 80. The results indicated a significant difference, t(29) = 2.45, p = 0.02.”
- Interpretation of p-value: Provide an interpretation of the p-value. If the p-value is less than 0.05, you can reject the null hypothesis and conclude that the sample mean is significantly different from the population mean.Example:
- “The results suggest that the students’ test scores are significantly higher than the national average, as the p-value is less than 0.05.”
- Effect Size (Optional): If applicable, you can report the effect size, such as Cohen’s d, to provide information about the magnitude of the difference between the sample mean and the population mean.Example:
- “The effect size, calculated as Cohen’s d = 0.45, indicates a moderate effect.”
Common Mistakes to Avoid
When performing the One-Sample T-Test and interpreting the results, there are several common mistakes that researchers should be aware of:
- Ignoring assumptions: While the One-Sample T-Test is relatively robust, it still assumes normality of the data. If the data are heavily skewed or the sample size is small, consider using a non-parametric alternative such as the Wilcoxon Signed-Rank Test.
- Misinterpreting p-values: A p-value less than 0.05 means that the difference is statistically significant, but it does not necessarily imply practical significance. Always consider the effect size when reporting results.
- Overlooking outliers: Outliers can significantly affect the results of the One-Sample T-Test. It is important to check for outliers before conducting the test.
- Not reporting effect size: While the p-value is important, the effect size provides valuable context for the practical significance of the results. Always report effect size, especially for small sample sizes.
Conclusion
The One-Sample T-Test is an essential tool in statistical analysis, allowing researchers to determine whether a sample mean differs significantly from a known population mean or benchmark. SPSS simplifies the process of conducting this test and interpreting the results. By following the steps outlined in this guide, researchers can confidently apply the One-Sample T-Test in SPSS and report the results clearly and accurately. Understanding how to interpret the t-statistic, p-value, and effect size is crucial for drawing meaningful conclusions from the analysis. Whether comparing academic scores, medical measurements, or other variables, the One-Sample T-Test is a versatile and widely used statistical method.
GetSPSSHelp is the best website for reporting One Sample T Test in SPSS Help because it provides expert guidance tailored to your specific analysis needs. Their team walks you through the entire process, from data input to interpreting the test results accurately. GetSPSSHelp ensures that your findings are presented clearly and in line with academic or professional standards. They simplify complex statistical concepts, making it easier for students to understand and report their results confidently. Additionally, GetSPSSHelp offers affordable services, timely delivery, and personalized support, making it the ideal choice for mastering One Sample T Test in SPSS.
Needs help with similar assignment?
We are available 24x7 to deliver the best services and assignment ready within 3-4 hours? Order a custom-written, plagiarism-free paper
