Reporting Pearson Correlation Analysis in SPSS: A Comprehensive Guide|2025
/in SPSS Articles /by BesttutorGet expert help with Reporting Pearson Correlation Analysis in SPSS: learn how to conduct the analysis, interpret the results, and present your findings clearly and accurately.
Pearson correlation analysis is a widely used statistical technique to measure the strength and direction of the linear relationship between two continuous variables. It is an essential tool in research across various fields, including psychology, social sciences, healthcare, business, and education, for understanding how two variables are related. By using SPSS (Statistical Package for the Social Sciences), researchers can easily perform Pearson correlation analysis and report the results accurately. This article provides a detailed, step-by-step guide on how to report Pearson correlation analysis in SPSS.
The article will cover the key concepts behind Pearson correlation, how to perform the analysis in SPSS, how to interpret the results, and how to report them in a clear, professional format. By focusing on common reporting standards and clear instructions for generating output, this guide ensures that researchers and students can make valid conclusions based on their data.
As searches for “Pearson correlation analysis in SPSS” and “how to report Pearson correlation” grow in popularity, this article aims to help users confidently handle data analysis tasks involving Pearson’s r and produce accurate, insightful reports.
Table of Contents
ToggleWhat is Pearson Correlation Analysis?
Pearson correlation is a statistical measure that expresses the extent to which two variables are related. The Pearson correlation coefficient (denoted as r) quantifies the degree of linear association between two continuous variables. The value of r ranges from -1 to +1, where:
- r = +1 indicates a perfect positive linear relationship.
- r = -1 indicates a perfect negative linear relationship.
- r = 0 indicates no linear relationship.
The closer r is to +1 or -1, the stronger the relationship between the two variables. A positive r value means that as one variable increases, the other variable also increases. A negative r value indicates that as one variable increases, the other decreases.
Assumptions of Pearson Correlation
Before performing a Pearson correlation analysis in SPSS, it is essential to verify that your data meets the assumptions for the test:
- Linearity: The relationship between the two variables should be linear.
- Normality: Both variables should be approximately normally distributed. This assumption can be checked using histograms or normality tests like the Shapiro-Wilk test.
- Homogeneity of Variance: The variability in one variable should be consistent across all levels of the other variable.
When to Use Pearson Correlation Analysis
Pearson correlation analysis is appropriate when both variables are continuous and normally distributed. It is particularly useful in research that aims to assess the strength of a relationship between two variables, such as:
- Assessing the relationship between income and education level.
- Examining the correlation between age and health-related behaviors.
- Investigating the association between customer satisfaction and product quality.

Performing Pearson Correlation in SPSS
SPSS is a powerful software tool for statistical analysis, and performing Pearson correlation is straightforward. The following steps outline how to run the analysis and interpret the results.
Step 1: Preparing the Data
Ensure that your data is organized correctly in SPSS. For Pearson correlation analysis, you need:
- Two continuous variables (e.g., height and weight, test scores and study time).
- The variables should be in numeric format and each observation should correspond to a pair of scores for both variables.
Step 2: Running Pearson Correlation in SPSS
- Open SPSS and load your dataset.
- From the menu, click Analyze → Correlate → Bivariate.
- In the Bivariate Correlations dialog box, select the two continuous variables you wish to analyze.
- Make sure the Pearson box is checked under the correlation coefficient options. You may also choose to check the Two-tailed option for a two-tailed test or One-tailed if you have a specific directional hypothesis.
- Click OK to run the analysis.
Step 3: Interpreting the SPSS Output
Once the Pearson correlation analysis is completed, SPSS will generate an output with the following key components:
- Correlation Coefficient (r): This value represents the strength and direction of the linear relationship between the two variables.
- Significance Value (p): The p-value indicates whether the correlation is statistically significant. A p-value less than 0.05 typically indicates a statistically significant correlation.
- N (Sample Size): This indicates the number of data pairs used in the analysis.
- Confidence Interval: The range of values within which the true correlation coefficient is likely to fall, typically with a 95% confidence level.
Reporting Pearson Correlation Results
When reporting the results of a Pearson correlation analysis in SPSS, it is essential to follow standard academic and professional guidelines to ensure clarity and accuracy. Here are the key components that should be included in your report:
Descriptive Statistics
Begin by reporting the descriptive statistics for the two variables involved in the analysis. This includes the mean, standard deviation, and sample size (N) for each variable.
Example: The mean height of participants was 170.5 cm (SD = 6.3), while the mean weight was 68.2 kg (SD = 9.4), based on a sample of 100 participants.
Pearson Correlation Coefficient (r)
The main result of the analysis is the Pearson correlation coefficient, which quantifies the strength and direction of the relationship between the two variables.
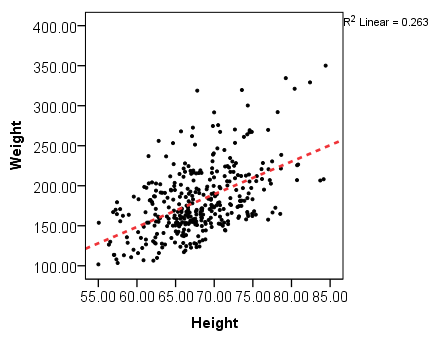
Example: A Pearson correlation was conducted to determine the relationship between height and weight in a sample of 100 participants. The results revealed a moderate, positive correlation, r(98) = 0.62, p < 0.001, indicating that as height increases, weight tends to increase as well.
Significance Level (p-value)
The p-value indicates whether the observed correlation is statistically significant. If the p-value is less than the chosen significance level (usually 0.05), the correlation is considered statistically significant.
Example: The correlation between height and weight was statistically significant (p < 0.001), suggesting that the observed relationship is unlikely to have occurred by chance.
Confidence Interval
Reporting the confidence interval for the correlation coefficient is important as it provides an estimate of the range within which the true correlation value lies.
Example: The 95% confidence interval for the Pearson correlation was [0.52, 0.71], indicating that the true correlation is likely to fall within this range.
Interpretation and Conclusion
Based on the results, provide a clear interpretation of the correlation and discuss its implications in the context of your research question or hypothesis.
Example: In conclusion, the Pearson correlation analysis indicates a moderate, positive relationship between height and weight. This suggests that, in general, taller individuals tend to have higher body weights, although other factors, such as age or gender, may also influence this relationship.
Common Mistakes to Avoid
When reporting Pearson correlation results, there are several common mistakes that should be avoided:
- Over-Interpretation of Correlation: Pearson correlation only measures linear relationships. It does not imply causality, so be cautious when making inferences about cause and effect.
- Ignoring Assumptions: Ensure that the assumptions of normality and linearity are met before performing the correlation analysis. Violations of these assumptions can lead to inaccurate results.
- Reporting Only the r-value: Always report the p-value and confidence intervals in addition to the correlation coefficient to provide a complete picture of the results.
- Misleading Statistical Language: Avoid using terms like “proof” or “prove” when interpreting results. Statistical significance only indicates the likelihood that the observed result is due to chance.

Conclusion
Reporting Pearson correlation analysis results in SPSS is an essential skill for researchers and students alike. By following the steps outlined in this guide, you can perform the analysis accurately, interpret the results effectively, and present your findings clearly. Pearson correlation provides valuable insights into the relationships between two continuous variables, and with proper reporting, your results can support valid conclusions and informed decision-making.
Whether you are conducting research for a dissertation, academic assignment, or professional project, understanding how to report Pearson correlation analysis will help you draw meaningful insights from your data and communicate your findings with confidence. By adhering to best practices in data analysis and reporting, you can ensure that your work is both scientifically rigorous and professionally presented.
GetSPSSHelp is the best website for Reporting Pearson Correlation Analysis in SPSS because it offers expert assistance in conducting and interpreting correlation analysis with precision. Their team provides step-by-step guidance, ensuring that each part of the analysis is accurately completed and reported. GetSPSSHelp simplifies complex statistical concepts, making it easy for students and researchers to understand and present their results. With personalized support, they help ensure that your findings are clearly communicated, adhering to academic and professional standards. Additionally, their timely delivery, affordable pricing, and reliable support make GetSPSSHelp the go-to resource for mastering Pearson Correlation Analysis in SPSS.
Needs help with similar assignment?
We are available 24x7 to deliver the best services and assignment ready within 3-4 hours? Order a custom-written, plagiarism-free paper
