Sample and Population Level Descriptive Analysis Using SPSS|2025
/in SPSS Articles /by BesttutorLearn how to perform Sample and Population Level Descriptive Analysis Using SPSS to summarize, interpret, and compare data effectively for academic and research projects.
In statistical research, understanding the nature of the data is crucial to making informed decisions and drawing meaningful conclusions. Descriptive analysis provides a summary of the sample or population, offering insights into patterns and distributions within the data. Descriptive statistics are fundamental in almost every field of research and are typically the first step before applying inferential techniques. This paper explores the role of descriptive analysis in both sample and population data, focusing on how SPSS (Statistical Package for the Social Sciences) can be employed to conduct such analyses. SPSS is widely used for statistical analysis, and this guide will delve into how researchers can use it effectively to perform sample and population level descriptive analysis.
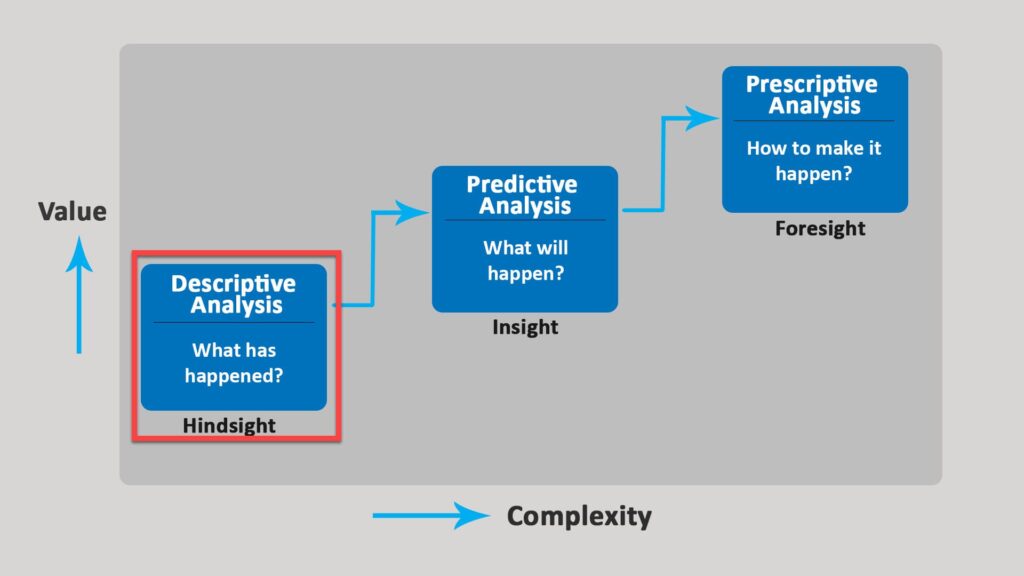
Table of Contents
ToggleDescriptive Statistics: An Overview
Descriptive statistics aim to summarize the main features of a dataset, providing simple summaries about the sample and the measures of central tendency, variability, and distribution. Descriptive analysis is typically used for both sample data (a subset of a population) and population data (the entire set). Descriptive statistics help researchers to organize and simplify data for easier interpretation and decision-making. The main types of descriptive statistics include:
- Measures of Central Tendency: These include the mean, median, and mode, which describe the “center” or “typical” value of a dataset.
- Measures of Variability: These include the range, variance, and standard deviation, which describe the spread or dispersion of the data.
- Measures of Distribution: These describe the shape and spread of the data, often represented using skewness and kurtosis.
- Frequency Distributions: These represent how often different values or groups occur in a dataset.
The Role of SPSS in Descriptive Statistics
SPSS is a powerful tool for performing descriptive statistics, offering a user-friendly interface and a wide range of options to perform data analysis. It is commonly used across various fields, including social sciences, business, healthcare, and education. SPSS allows users to compute central tendencies, variability measures, and graphical representations of data with relative ease.
Using SPSS, researchers can compute and visualize descriptive statistics, generate frequency tables, histograms, bar charts, and box plots, and assess the normality of data distributions. SPSS is an essential tool for data management, enabling the transformation and recoding of variables and the creation of new variables for analysis.
Sample vs. Population in Descriptive Statistics
Before diving into how SPSS handles descriptive analysis, it is important to understand the distinction between a sample and a population.
-
Sample: A sample is a subset of a population that is selected for analysis. The goal of sampling is to draw conclusions about a population based on a smaller group. The sample should be representative of the population to ensure that the results are generalizable.
-
Population: A population refers to the entire group that is the subject of study. It includes every individual or unit that fits a particular set of criteria. In practice, it is often difficult or impossible to analyze an entire population, which is why researchers rely on samples to make inferences.
Descriptive statistics are performed differently depending on whether the data comes from a sample or a population. For example, when analyzing a sample, SPSS will often provide estimates that include adjustments for sampling error, while data from a population does not require such adjustments.

Step-by-Step Guide to Performing Descriptive Analysis in SPSS
1. Importing Data into SPSS
To begin conducting descriptive analysis in SPSS, you first need to load your dataset into the software. SPSS supports a variety of data formats, including Excel (.xls), CSV (.csv), and SPSS’s native .sav format. To import data, follow these steps:
- Open SPSS.
- Go to
File > Open > Data. - Browse for your dataset and click “Open.”
Once the data is loaded, it will be displayed in the Data View window, where each row represents a case and each column represents a variable.
2. Descriptive Statistics: Basic Measures
The first step in descriptive analysis is to obtain the basic descriptive statistics for your dataset. In SPSS, you can do this by:
- Go to
Analyze > Descriptive Statistics > Descriptives. - In the Descriptives dialog box, select the variables for which you want to compute the statistics.
- Click on the
Optionsbutton to choose additional statistics like the mean, standard deviation, minimum, maximum, skewness, and kurtosis.
SPSS will generate output that includes the mean, standard deviation, range, and other key descriptive measures. You can use these measures to get a quick understanding of the data’s central tendency and variability.
3. Measures of Central Tendency
Mean
The mean is the most common measure of central tendency, calculated by summing all values and dividing by the number of observations. It is a useful summary measure but can be sensitive to outliers.
Median
The median is the middle value in a dataset when the values are ordered from smallest to largest. Unlike the mean, the median is not affected by extreme values.
Mode
The mode represents the most frequently occurring value in a dataset. A dataset may have more than one mode (bimodal or multimodal) or no mode at all.
4. Measures of Dispersion
Standard Deviation
The standard deviation measures the average deviation of each data point from the mean. A higher standard deviation indicates more variability within the data, while a lower standard deviation suggests the data points are closer to the mean.
Range
The range is the difference between the maximum and minimum values in a dataset, providing a simple measure of data spread.
Variance
Variance is the square of the standard deviation. It is often used in inferential statistics but provides a less intuitive measure of variability than the standard deviation.
5. Frequency Distribution and Graphical Representation
In addition to numerical summaries, it is helpful to visualize the data distribution. SPSS offers several graphical tools to help analyze the data visually, such as histograms, bar charts, and box plots.
Frequency Tables
To generate a frequency table in SPSS, go to Analyze > Descriptive Statistics > Frequencies. This will give you the frequency, cumulative frequency, and percentage for each category of a categorical variable.
Histograms
A histogram is a graphical representation of a frequency distribution. To create a histogram in SPSS, go to Graphs > Legacy Dialogs > Histogram, and select the variable of interest. The histogram helps you understand the shape of the data distribution, including its symmetry or skewness.
Box Plots
A box plot is useful for visualizing the spread of the data and identifying outliers. To create a box plot in SPSS, go to Graphs > Legacy Dialogs > Boxplot. This will display the median, quartiles, and potential outliers.
6. Assessing Normality
One critical aspect of descriptive analysis is assessing whether the data follows a normal distribution. Many inferential statistical techniques assume normality, so it’s important to check for skewness and kurtosis.
- Skewness measures the asymmetry of the data distribution.
- Kurtosis measures the “tailedness” of the distribution.
In SPSS, you can obtain skewness and kurtosis values through the Descriptives option. For a normal distribution, the skewness and kurtosis values should be close to zero.
7. Descriptive Statistics for Different Groups
In many cases, researchers need to compare descriptive statistics between different groups. SPSS allows users to generate group-based statistics by splitting the dataset.
To perform descriptive analysis for different groups:
- Go to
Data > Split File. - Choose
Organize output by groupsand select the grouping variable. - Now, any descriptive statistics you calculate will be separated by the group.
For example, if you are comparing the average income of different age groups, SPSS will calculate separate means for each age group.
:max_bytes(150000):strip_icc()/Descriptive_statistics-5c8c9cf1d14d4900a0b2c55028c15452.png)
Interpreting Descriptive Statistics Results
Once SPSS generates the descriptive statistics and visualizations, the next step is interpretation. Researchers need to make sense of the numbers and decide how they relate to their research questions. Key points to consider include:
- Central Tendency: What is the typical or average value in the dataset?
- Variation: How much do the values vary from the average?
- Distribution Shape: Is the distribution symmetric or skewed? Are there any potential outliers?
- Comparison Across Groups: How do different groups compare in terms of central tendency and variability?
Conclusion
By understanding the basics of descriptive statistics and leveraging SPSS, researchers can ensure that their data analyses are both accurate and insightful. This foundational step in data analysis sets the stage for further statistical techniques, including hypothesis testing and regression analysis. Thus, mastering descriptive analysis using SPSS is a key skill for any researcher aiming to conduct robust and reliable data analysis.
Needs help with similar assignment?
We are available 24x7 to deliver the best services and assignment ready within 3-4 hours? Order a custom-written, plagiarism-free paper
