Statistical Analysis and Reliability Analysis: A Comprehensive Overview|2025
Explore Statistical Analysis and Reliability Analysis: A Comprehensive Overview. Learn key concepts, methods, and applications for accurate data evaluation.
Introduction: Statistical analysis is a key component of data interpretation, helping researchers, analysts, and professionals draw meaningful conclusions from their data. In this paper, we will explore the concept of statistical analysis, discuss various statistical tests, and explain how reliability analysis plays an essential role in ensuring the validity of research findings. Additionally, we will delve into resources and tools such as SPSS and Excel to facilitate statistical analysis and reliability testing. The paper will cover important keywords related to statistical tests, their application, and provide links to helpful resources like PDF tutorials and guides for using statistical tools effectively.
Understanding Statistical Analysis
Statistical analysis refers to the collection, examination, and interpretation of data using mathematical techniques. The goal is to extract insights and make informed decisions. Statistical tools provide various methods for analyzing data, each suitable for different types of research questions. The most commonly used tools are statistical software packages such as SPSS (Statistical Package for the Social Sciences) and Excel, which help automate complex analyses, reducing errors and ensuring efficiency.
Choosing the Right Statistical Tool
Choosing the right statistical test is crucial for obtaining reliable results. Depending on the nature of the data, the researcher may need to apply different tests. Here are the considerations that guide this decision:
- Nature of the data: Nominal, ordinal, interval, or ratio.
- Research question: Are we comparing groups, predicting relationships, or measuring variability?
- Sample size: Large sample sizes may require different tests than small sample sizes.
- Assumptions: Whether the data meets certain assumptions like normality, homogeneity of variance, etc.
Statistical Tools with SPSS
SPSS is a popular tool for statistical analysis. Many researchers use SPSS tutorials PDF with examples to understand how to navigate the software and apply it to their research. SPSS simplifies tasks such as calculating mean, standard deviation, performing t-tests, ANOVA, regression analysis, and more. One common question that arises is: “Choosing the right statistical tool with SPSS help free”. Here, free resources such as PDF guides, user forums, and tutorial videos can be helpful in learning how to use the software.
Choosing the Right Statistical Tool with SPSS Help PDF and Choosing the Right Statistical Tool with SPSS Help Excel can also address questions on compatibility between SPSS and Excel data sets. SPSS is capable of importing data from Excel and conducting a variety of statistical tests. In fact, Choosing the Right Statistical Tool with SPSS Help Excel is a helpful tool for those who are familiar with Excel but want to expand their analysis capabilities using SPSS.
Statistical Tests and Their Applications
Statistical tests are the backbone of data analysis. These tests help determine relationships between variables, compare groups, or test hypotheses. The List of Statistical Tests and When to Use Them PDF provides a comprehensive overview of the different statistical tests available. Below, we will describe several commonly used statistical tests and their applications:
t-test for Independent Samples
The t-test is one of the most widely used statistical tests to compare the means of two independent groups. When researchers wish to know whether there is a significant difference between two groups on a single dependent variable, the Statistical test for 2 independent variables and 1 dependent variable applies.
- When to use: When comparing two independent groups (e.g., males vs. females, treatment group vs. control group).
- Example: Comparing the test scores of two different classrooms.
ANOVA (Analysis of Variance)
ANOVA is used when comparing means across three or more groups. It is an extension of the t-test that allows for multiple comparisons simultaneously. There are different types of ANOVA, including one-way and two-way ANOVA.
- When to use: When comparing means across multiple groups.
- Example: Comparing the test scores of students from three different teaching methods.
Chi-Square Test
The chi-square test is used to assess the relationship between two categorical variables. It compares the expected and observed frequencies to determine if there is a significant association.
- When to use: When working with categorical data (nominal or ordinal).
- Example: Testing the relationship between gender and political preference.
Regression Analysis
Regression analysis is used to examine the relationship between one or more independent variables and a dependent variable. It helps predict the value of the dependent variable based on the values of the independent variables.
- When to use: When predicting or modeling a continuous dependent variable.
- Example: Predicting a person’s salary based on years of experience and education level.

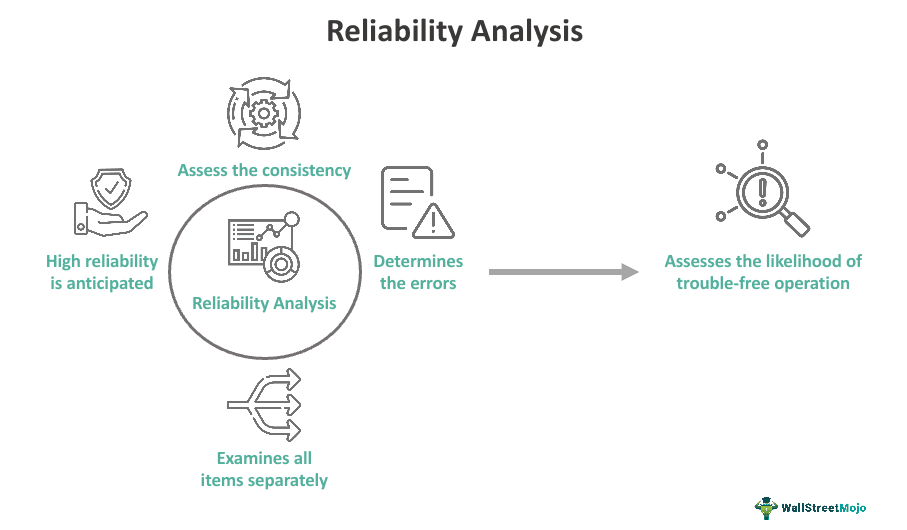
Reliability Analysis
Reliability analysis refers to the consistency of a measure or instrument over time. It is an important aspect of research, as it ensures that the findings are not due to random error or bias.
Types of Reliability
- Test-Retest Reliability: The consistency of a test over time.
- Inter-Rater Reliability: The degree to which different raters or judges give consistent estimates.
- Internal Consistency: The extent to which items within a test or scale are related to each other.
Reliability Analysis in SPSS
SPSS provides tools to test reliability using different methods, such as calculating Cronbach’s alpha for internal consistency. Researchers can also perform inter-rater reliability analysis or examine test-retest reliability with SPSS. Using SPSS tutorial PDF with examples can help users better understand how to perform reliability tests on their data.
Resources and Learning Tools
Several free resources can help individuals understand and apply statistical analysis using software like SPSS and Excel. Below is a list of helpful tools:
- SPSS Help Guides:
- Choosing the Right Statistical Tool with SPSS Help PDF: A guide to help choose the appropriate statistical test for different data types and research questions.
- SPSS Tutorial PDF with Examples: A step-by-step guide with examples for using SPSS to perform different statistical tests.
- SPSS and Excel Integration:
- Choosing the Right Statistical Tool with SPSS Help Excel: A guide that shows how to transfer data between Excel and SPSS, helping users analyze Excel data in SPSS.
- Statistical Test Resources:
- List of Statistical Tests and When to Use Them PDF: A comprehensive list of statistical tests, including when and how to apply them based on the nature of your data.
- What Statistical Test to Use When Comparing Two Groups: A helpful resource for understanding which tests to apply when comparing two groups, whether it’s a t-test or another test.

Conclusion
Statistical analysis is essential for making informed decisions based on data. Choosing the right statistical test, understanding when and how to use it, and ensuring the reliability of your results are all crucial steps in the research process. Tools like SPSS and Excel can streamline this process, making it easier to apply complex statistical methods without extensive programming knowledge.
By utilizing resources such as Choosing the Right Statistical Tool with SPSS Help PDF and SPSS tutorial PDF with examples, researchers can gain a deeper understanding of statistical analysis and its application. Whether you’re testing hypotheses, comparing groups, or predicting relationships, these tools and techniques will help ensure the validity and reliability of your findings.
Needs help with similar assignment?
We are available 24x7 to deliver the best services and assignment ready within 3-4 hours? Order a custom-written, plagiarism-free paper
