Step-by-Step SPSS Assignment Help with Interpretation of Results|2025
Looking for Step-by-Step SPSS Assignment Help with Interpretation of Results? Our expert services guide you through each stage of your SPSS assignment, from data analysis to clear, accurate result interpretation. With tailored assistance and a focus on your academic success, we make complex assignments easier to complete.
SPSS (Statistical Package for the Social Sciences) is a powerful software used for statistical analysis in social science research, business, healthcare, and many other fields. Students and professionals often encounter challenges in using SPSS, especially when interpreting results. This guide provides a step-by-step approach to completing SPSS assignments, ensuring accuracy and clarity in data analysis and interpretation.
Understanding SPSS Basics
Before diving into your SPSS assignment, it’s essential to understand the basics:
- What is SPSS? SPSS is a statistical software package used to analyze quantitative data. It includes features for data entry, manipulation, and statistical analysis.
- Why use SPSS? SPSS simplifies complex statistical calculations, provides visual representations of data, and ensures reliable results.
- SPSS Interface Overview
- Data View: Displays raw data in a spreadsheet format.
- Variable View: Displays metadata about variables, including names, types, and labels.
- Output Viewer: Displays statistical results and charts.
Step 1: Define Your Research Questions and Hypotheses
The first step in any SPSS assignment is defining your research questions and hypotheses. These guide your analysis and help determine the appropriate statistical tests.
- Example: Research Question: Does the amount of time spent studying affect exam scores?
- Hypothesis: Students who spend more time studying achieve higher exam scores.
Step 2: Collect and Input Data
- Collect Data: Gather your data using surveys, experiments, or secondary sources.
- Input Data into SPSS:
- Open SPSS and navigate to the “Data View.”
- Enter your data, ensuring each column represents a variable and each row represents a case.
- Define Variables:
- Switch to “Variable View.”
- Assign variable names, types (e.g., numeric, string), and labels.
- Specify measurement levels: nominal, ordinal, or scale.
Step 3: Choose the Appropriate Statistical Test
Selecting the correct statistical test is critical. The choice depends on the type of data and your research questions.
- Descriptive Statistics: Use for summarizing data (e.g., mean, median, mode).
- Inferential Statistics: Use for hypothesis testing (e.g., t-tests, ANOVA, regression analysis).
Common Tests in SPSS:
- T-Test: Compare means between two groups.
- ANOVA: Compare means across multiple groups.
- Chi-Square Test: Examine relationships between categorical variables.
- Correlation: Assess relationships between continuous variables.
- Regression: Predict one variable based on another.
Step 4: Run the Analysis in SPSS
- Descriptive Statistics:
- Navigate to “Analyze > Descriptive Statistics > Frequencies” or “Descriptive Statistics.”
- Select variables and click “OK.”
- The output will display summary statistics.
- Inferential Tests:
- Navigate to “Analyze” and select the appropriate test.
- For example, for a t-test:
- Go to “Analyze > Compare Means > Independent-Samples T-Test.”
- Assign variables to the appropriate fields and click “OK.”
- Check Assumptions: Many statistical tests have assumptions (e.g., normality, homogeneity of variance). Use SPSS tools like histograms, boxplots, and Levene’s test to check these assumptions.
Step 5: Interpret SPSS Output
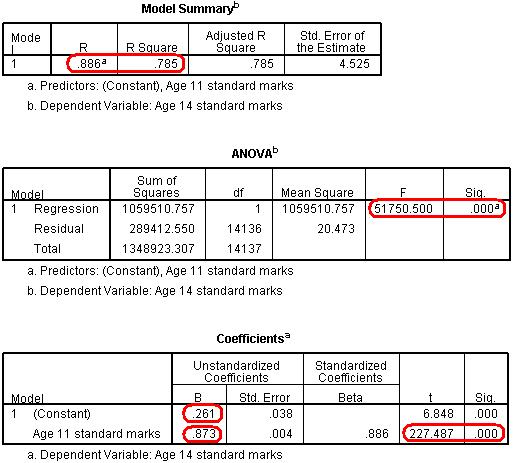
Interpreting SPSS results can be challenging. Here’s a breakdown of common output components:
- Descriptive Statistics:
- Mean: Average value.
- Standard Deviation: Measure of variability.
- Frequency Tables: Distribution of categorical variables.
- Inferential Statistics:
- P-Value: Determines statistical significance. A p-value < 0.05 indicates significant results.
- Test Statistics (e.g., t, F, χ²): Indicates the magnitude and direction of the effect.
- Confidence Intervals: Range of values within which the true population parameter lies.
Example:
- A t-test output shows:
- Mean difference between groups.
- T-value and degrees of freedom.
- P-value (e.g., p = 0.03 suggests significance).
- Visualizations: SPSS generates charts and graphs (e.g., bar charts, scatterplots) to aid interpretation. Ensure these visualizations align with your findings.
Step 6: Report Results
Presenting your findings is as important as the analysis itself. Use clear and concise language, ensuring your report aligns with academic or professional standards.
- Structure Your Report:
- Introduction: Briefly describe your research question and hypothesis.
- Methods: Explain how data was collected and analyzed.
- Results: Present key findings, including statistics, p-values, and visualizations.
- Discussion: Interpret results in the context of your research question.
- APA Formatting: If your assignment requires APA formatting, adhere to guidelines for tables, figures, and statistical reporting.
Example of Reporting:
- “An independent-samples t-test was conducted to compare exam scores between groups. Results indicated a significant difference (t(28) = 2.45, p = 0.02), suggesting students who studied more had higher scores.”
Step 7: Troubleshooting Common Issues
SPSS assignments can be daunting due to various challenges. Here are common issues and solutions:
- Error Messages:
- Double-check variable definitions and data entry.
- Ensure compatibility between data and selected tests.
- Missing Data:
- Use SPSS’s “Transform > Compute Variable” to handle missing values.
- Complex Data Structures:
- Consult SPSS’s advanced features, such as multivariate analysis or hierarchical regression.
SPSS Interpretation Examples
To further illustrate, here are examples of SPSS analyses with interpretation:
Example 1: Correlation Analysis
- Scenario: Investigate the relationship between study time and exam scores.
- SPSS Output: Pearson correlation = 0.78, p < 0.01.
- Interpretation: A strong, positive correlation suggests that increased study time is associated with higher exam scores.
Example 2: ANOVA
- Scenario: Compare exam scores across three study methods.
- SPSS Output: F(2, 27) = 5.12, p = 0.01.
- Interpretation: Significant differences exist between groups. Post hoc tests reveal Method A outperforms Methods B and C.
Example 3: Regression Analysis
- Scenario: Predict salary based on years of experience.
- SPSS Output: R² = 0.65, B = 3.5, p < 0.001.
- Interpretation: Years of experience explain 65% of salary variation. Each additional year adds $3,500 to the predicted salary.
Tips for Success in SPSS Assignments
- Understand Your Data: Familiarize yourself with variable types and measurement levels.
- Use Resources: Refer to SPSS manuals, online tutorials, and academic guides.
- Practice Regularly: Regular use of SPSS builds confidence and proficiency.
- Seek Help: Don’t hesitate to seek expert guidance for complex analyses.
Conclusion
Completing SPSS assignments involves a systematic approach: understanding your research question, inputting data, selecting the right tests, running analyses, and interpreting results. By following the steps outlined in this guide, you can confidently tackle SPSS assignments and produce high-quality reports. Whether you’re a student or professional, mastering SPSS is a valuable skill that enhances your analytical capabilities.
Needs help with similar assignment?
We are available 24x7 to deliver the best services and assignment ready within 3-4 hours? Order a custom-written, plagiarism-free paper


