The Kruskal-Wallis Test: Rank-Sum and H Test, Benefits, and Practical Applications|2025
/in SPSS Articles /by BesttutorExplore The Kruskal-Wallis Test: Rank-Sum and H Test, benefits, and practical applications. Learn how this non-parametric test is used to compare multiple groups effectively.
In statistics, the Kruskal-Wallis test is a non-parametric method used for comparing more than two independent groups to determine if there are statistically significant differences between them. This test is an extension of the Mann-Whitney U test (also known as the Wilcoxon rank-sum test), which is used for two independent groups. Often referred to as the “Rank-Sum Test” and “H Test,” the Kruskal-Wallis test is valuable in research contexts where the assumptions for parametric tests (such as ANOVA) cannot be met.
It is particularly useful for ordinal data or non-normally distributed data. This paper will explore the Kruskal-Wallis test, its interpretation, benefits, and applications in research, along with a detailed understanding of its formula, when to use the test, how to report the results, and how it compares to similar non-parametric tests like the Friedman test and Mann-Whitney U test.

Table of Contents
ToggleWhat is the Kruskal-Wallis Test?
The Kruskal-Wallis test, developed by William Kruskal and W. Allen Wallis in 1952, is used when researchers want to compare the ranks of more than two independent groups. It is particularly effective when the data does not meet the assumptions necessary for an analysis of variance (ANOVA), such as normality of the data. As a non-parametric test, the Kruskal-Wallis test does not assume a specific distribution of the data, making it more flexible and robust for various research scenarios.
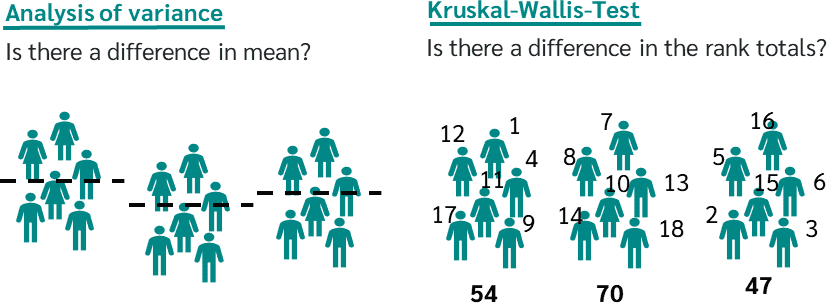
This test is based on ranking all the data points across the groups, regardless of their original group membership. The test compares the sum of ranks between the groups, with the null hypothesis suggesting that all groups have the same distribution of ranks (i.e., no significant differences between them). If the test statistic, H, is large enough, the null hypothesis is rejected, indicating that at least one of the groups differs significantly from the others.
Why is the Kruskal-Wallis Test Known as the Rank-Sum and H Test?
The Kruskal-Wallis test is often referred to as the “Rank-Sum Test” due to its reliance on ranking the data values. In a typical scenario, the data points across all groups are pooled together, and the values are assigned ranks from lowest to highest. The rank sums for each group are then calculated and compared. The term “rank-sum” highlights the method of summing the ranks within each group to assess differences between the groups.
Additionally, the Kruskal-Wallis test is known as the “H Test” because the test statistic is denoted by H. The formula for H incorporates the rank sums for each group and the number of data points in each group. The value of H determines whether there is a statistically significant difference between the groups. A high value of H suggests a large difference between the rank sums of the groups, indicating a significant difference between the groups.
Kruskal-Wallis H Test Formula
The Kruskal-Wallis test formula is used to calculate the test statistic, H, which is compared to a chi-square distribution to determine statistical significance. The formula is:
H=12N(N+1)∑i=1kRi2ni−3(N+1)H = \frac{12}{N(N+1)} \sum_{i=1}^{k} \frac{R_i^2}{n_i} – 3(N+1)H=N(N+1)12i=1∑kniRi2−3(N+1)Where:
- NNN is the total number of observations across all groups
- kkk is the number of groups
- RiR_iRi is the sum of ranks for the iii-th group
- nin_ini is the number of observations in the iii-th group
Kruskal-Wallis Test in Research
In research, the Kruskal-Wallis test is used when researchers need to compare three or more independent groups, but the data does not meet the assumptions for parametric tests. For example, it is particularly useful in social sciences, medical research, and psychology, where data may be skewed or ordinal in nature.
Researchers might use the Kruskal-Wallis test in situations where they want to compare groups based on certain characteristics, such as:
- Testing if different treatment groups show significantly different outcomes in a clinical trial.
- Comparing the effectiveness of various teaching methods across different schools.
- Evaluating customer satisfaction across several service providers.
By using this non-parametric test, researchers can analyze the data without the need for assumptions about normality, making it an important tool for real-world research situations where data often violates parametric assumptions.
When to Use the Kruskal-Wallis Test
The Kruskal-Wallis test is appropriate when the following conditions are met:
- Three or more independent groups: The Kruskal-Wallis test is designed for comparing three or more independent groups. If there are only two groups, the Mann-Whitney U test is preferred.
- Ordinal or non-normally distributed data: The test is ideal when the data are ordinal (i.e., rankings) or when the assumptions of normality are violated. In such cases, it is more robust than parametric alternatives like ANOVA.
- Independent observations: The data points in each group must be independent of each other. The Kruskal-Wallis test cannot be used when there are repeated measurements or correlated data.
Comparing the Kruskal-Wallis Test with Other Non-Parametric Tests
While the Kruskal-Wallis test is used to compare independent groups, there are other non-parametric tests that researchers may consider depending on their data and research questions.
- Friedman Test: The Friedman test is a non-parametric alternative to the repeated measures ANOVA. It is used when there are three or more related groups, unlike the Kruskal-Wallis test, which is used for independent groups. The Friedman test is commonly used in experimental designs where the same participants are exposed to multiple conditions.
- Mann-Whitney U Test: The Mann-Whitney U test, also known as the Wilcoxon rank-sum test, is used for comparing two independent groups. While the Kruskal-Wallis test is an extension of the Mann-Whitney U test, it is used when there are more than two groups. Both tests are based on rank sums, but the Mann-Whitney U test is limited to two groups.
Benefits of the Kruskal-Wallis Test
The Kruskal-Wallis test offers several advantages over parametric tests like ANOVA:
- No Assumption of Normality: Unlike ANOVA, the Kruskal-Wallis test does not assume that the data are normally distributed. This makes it ideal for data that are skewed or not continuous.
- Applicable to Ordinal Data: The Kruskal-Wallis test can be used to analyze ordinal data, where the distances between data points are not meaningful or equal.
- Robust to Outliers: The Kruskal-Wallis test is less sensitive to outliers compared to parametric tests, making it suitable for datasets with extreme values.
- Flexibility: The test can be used with different types of data, making it a versatile tool in a wide range of research fields.
How to Report Kruskal-Wallis Results
When reporting the results of a Kruskal-Wallis test, it is important to include the test statistic, degrees of freedom, and p-value. The interpretation of the test result depends on whether the p-value is below a certain threshold (usually 0.05), indicating that there is a significant difference between the groups.
Example:
- “A Kruskal-Wallis test was conducted to compare the effects of three different teaching methods on student performance. There was a significant difference in performance between the groups, H(2)=9.46,p=0.009H(2) = 9.46, p = 0.009H(2)=9.46,p=0.009, indicating that at least one teaching method was more effective than the others.”

How to Report Kruskal-Wallis Results in APA Style
In APA style, the results of the Kruskal-Wallis test should be reported in a clear and concise manner. The test statistic (H), degrees of freedom (df), and p-value should be included. The result should be reported as follows:
- “A Kruskal-Wallis H test was conducted to determine if there were differences in [outcome] among [number of groups] groups. The test was statistically significant, H(df)=H-value,p=p-valueH(\text{df}) = \text{H-value}, p = \text{p-value}H(df)=H-value,p=p-value.”
Example:
- “A Kruskal-Wallis H test was conducted to determine if there were differences in customer satisfaction ratings among three service providers. The test was statistically significant, H(2)=10.52,p=0.005H(2) = 10.52, p = 0.005H(2)=10.52,p=0.005.”
Conclusion
The Kruskal-Wallis test is a powerful non-parametric tool for comparing more than two independent groups, particularly when data do not meet the assumptions of parametric tests like ANOVA. Its reliance on ranks rather than raw data makes it robust and applicable to a wide range of data types, including ordinal and non-normally distributed data. By understanding its formula, benefits, and when to use it, researchers can make more informed decisions when analyzing data. The Kruskal-Wallis test, along with other non-parametric tests like the Friedman test and Mann-Whitney U test, provides valuable insights in various fields, from social sciences to healthcare, making it an essential tool for researchers.
Needs help with similar assignment?
We are available 24x7 to deliver the best services and assignment ready within 3-4 hours? Order a custom-written, plagiarism-free paper
