Understand All About T Test|2025
Understand All About T Test, a statistical method used to compare means and analyze data. Learn how to conduct a T-test, interpret results, and apply it in research and decision-making.
Statistical analysis is a cornerstone of data interpretation in research, and the t-test is one of the most commonly used statistical methods. With the advent of user-friendly software like SPSS (Statistical Package for the Social Sciences), conducting and interpreting t-tests has become significantly more accessible. This paper delves into the intricacies of t-tests, illustrating their application with SPSS through examples, interpretations, and step-by-step guidance.
:max_bytes(150000):strip_icc()/t-test_final2-d26bbb129cc441c192ccf8e784ae06a4.png)
What is a T-Test?
A t-test is a statistical method used to compare the means of two groups to determine whether there is a statistically significant difference between them. It is particularly useful when dealing with small sample sizes. The t-test assumes the data is normally distributed and that the variances of the two groups are equal (homogeneity of variance).
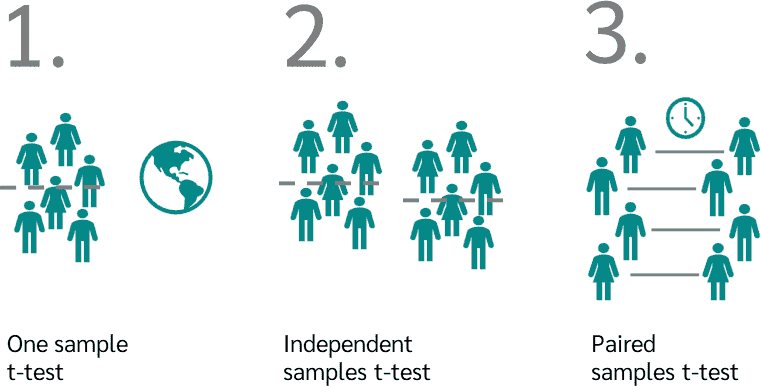
There are three main types of t-tests:
- Independent Samples T-Test: Compares the means of two independent groups.
- Paired Samples T-Test: Compares the means of two related groups, such as measurements before and after a treatment.
- One-Sample T-Test: Compares the mean of a single group against a known value or population mean.
Independent T-Test
An independent t-test evaluates whether the means of two independent groups differ significantly. For instance, researchers may want to compare test scores of students from two different schools.
Formula for Independent T-Test
The formula for the independent t-test is:
Where:
- and : Means of groups 1 and 2
- and : Variances of groups 1 and 2
- and : Sample sizes of groups 1 and 2
Example Problem
A researcher measures the performance of two groups of students: one using traditional learning methods and the other using e-learning methods. Scores for the traditional group are [78, 82, 88, 85, 90], and scores for the e-learning group are [85, 87, 91, 89, 92].
Solution with SPSS
- Input Data: Enter the data into SPSS with two columns: “Group” (categorical) and “Scores” (scale).
- Run the Test: Navigate to Analyze > Compare Means > Independent-Samples T-Test. Assign “Scores” as the test variable and “Group” as the grouping variable.
- Interpret Output: The SPSS output includes a Levene’s Test for equality of variances and the t-test results. If the p-value for Levene’s Test is greater than 0.05, assume equal variances. If the p-value for the t-test is less than 0.05, there is a significant difference between the groups.
Paired Samples T-Test
A paired samples t-test compares the means of two related groups. It is commonly used in pre-test/post-test designs to assess the effect of an intervention.
Example Problem
Suppose a group of 10 participants is tested before and after a training program. Their pre-test scores are [65, 70, 72, 68, 75, 78, 80, 76, 73, 77], and their post-test scores are [70, 75, 78, 72, 80, 85, 83, 79, 78, 80].
Solution with SPSS
- Input Data: Enter the data into SPSS with two columns: “Pre-Test” and “Post-Test.”
- Run the Test: Go to Analyze > Compare Means > Paired-Samples T-Test and select “Pre-Test” and “Post-Test.”
- Interpret Output: The SPSS output includes the mean difference, standard deviation, and p-value. If the p-value is less than 0.05, the training program significantly impacted the participants’ scores.
T-Test SPSS Interpretation
Interpreting the SPSS output of a t-test involves analyzing several key components:
- Descriptive Statistics: Provides the mean, standard deviation, and sample size for each group.
- Levene’s Test: Tests the equality of variances. If the p-value is greater than 0.05, equal variances are assumed.
- T-Test Results:
- t-value: Indicates the magnitude of the difference between groups.
- Degrees of Freedom (df): Reflects the sample size and is used to interpret the t-value.
- p-value: If less than 0.05, the null hypothesis (no difference between means) is rejected.
Example
For an independent samples t-test comparing the means of two groups, SPSS provides two rows in the t-test output: one assuming equal variances and one not. If Levene’s Test p-value is >0.05, interpret the row assuming equal variances.
Independent Samples T-Test SPSS
An independent samples t-test is one of the most commonly performed analyses in SPSS. It is used to compare the means of two unrelated groups.
Example with SPSS Steps
- Scenario: A company wants to compare the productivity of employees working remotely versus those working in-office.
- Data Entry: Create two columns in SPSS: “Work Environment” (remote or in-office) and “Productivity” (numerical scores).
- Analysis: Navigate to Analyze > Compare Means > Independent-Samples T-Test.
- Group Definition: Define “Work Environment” as the grouping variable and “Productivity” as the test variable.
- Output Interpretation:
- Check Levene’s Test.
- Review the t-test results to determine if productivity differs significantly.
Independent T-Test Example Problems with Solutions
Problem 1: Comparing Test Scores
- Scenario: A teacher compares test scores of students taught using two different teaching methods.
- Data: Method A: [85, 87, 90, 86, 88]; Method B: [78, 82, 85, 80, 84].
- Solution in SPSS:
- Enter the data into SPSS.
- Perform an independent samples t-test.
- Interpret the output to determine if the teaching methods significantly impacted scores.
Problem 2: Analyzing Marketing Campaign Effectiveness
- Scenario: A company tests two marketing strategies by measuring sales performance.
- Data: Strategy X: [120, 125, 130, 128, 135]; Strategy Y: [110, 115, 112, 118, 120].
- Solution: Follow the steps for an independent samples t-test in SPSS to evaluate the effectiveness of the strategies.

Paired Sample T-Test SPSS
The paired samples t-test is ideal for before-and-after comparisons within the same group.
Example with Steps
- Scenario: A researcher evaluates the impact of a new diet on weight loss. Initial weights are [200, 210, 190, 220, 205], and weights after 3 months are [195, 205, 185, 215, 200].
- SPSS Procedure:
- Enter pre-diet and post-diet weights into two columns.
- Perform a paired samples t-test via Analyze > Compare Means > Paired-Samples T-Test.
- Analyze the mean difference and p-value to determine the diet’s impact.
Common Issues and Solutions in T-Test Analysis
- Violation of Assumptions:
- Use non-parametric tests (e.g., Mann-Whitney U test) if data violates normality or homogeneity of variance assumptions.
- Outliers:
- Identify and address outliers as they can skew results.
- Sample Size:
- Ensure sufficient sample sizes to enhance the test’s power.

Conclusion
Understanding t-tests and their application in SPSS enables researchers to make informed decisions based on data. Whether it is an independent t-test or paired samples t-test, SPSS provides robust tools to conduct these analyses efficiently. By mastering t-test formulas, interpretations, and common problems, users can confidently utilize this statistical method to derive meaningful insights from their data. Whether you’re a student, researcher, or professional, learning to navigate SPSS with examples, like those provided in this paper, will enhance your statistical analysis proficiency.
For further information, consult resources like “Understand All About T-Test with SPSS Help PDF” or explore detailed examples to refine your expertise.
Needs help with similar assignment?
We are available 24x7 to deliver the best services and assignment ready within 3-4 hours? Order a custom-written, plagiarism-free paper
