Understanding the Basics of SPSS|2025
Start your data analysis journey by Understanding the Basics of SPSS. This beginner-friendly guide covers essential features, data entry, variable setup, and basic statistical tests to help students and researchers confidently navigate SPSS and perform accurate, efficient analyses.
Introduction
In today’s data-driven world, having the right tools to analyze data is essential. One of the most widely used statistical software packages is IBM SPSS Statistics. Designed for beginners and professionals alike, SPSS simplifies complex data analysis and is a powerful tool for social scientists, healthcare researchers, marketers, and educators. This article offers a comprehensive guide to understanding the basics of SPSS, using highly searched terms to help you find the information you need quickly and efficiently.

What is SPSS?
SPSS, which stands for Statistical Package for the Social Sciences, is a software program developed by IBM for statistical analysis. It is commonly used in social sciences, psychology, health research, education, marketing, and business. SPSS enables users to perform descriptive statistics, regression analysis, ANOVA, and various advanced statistical procedures with ease.
Key Features of SPSS
SPSS is known for its:
- User-friendly interface: Ideal for users who are not familiar with programming languages.
- Data management capabilities: Easily sort, filter, and manipulate datasets.
- Comprehensive statistical tools: Includes descriptive, inferential, and predictive analytics.
- Customizable output: Create graphs, tables, and exportable reports.
These features make SPSS one of the most sought-after data analysis tools in research and academia.
Why Use SPSS for Data Analysis?
There are several reasons why SPSS is the go-to tool for many data analysts:
- Accuracy and reliability: Ensures statistically valid results.
- Ease of use: Great for beginners and professionals alike.
- Support for various data formats: Accepts Excel, CSV, and database files.
- Extensive documentation and community support: Easy access to tutorials and troubleshooting help.
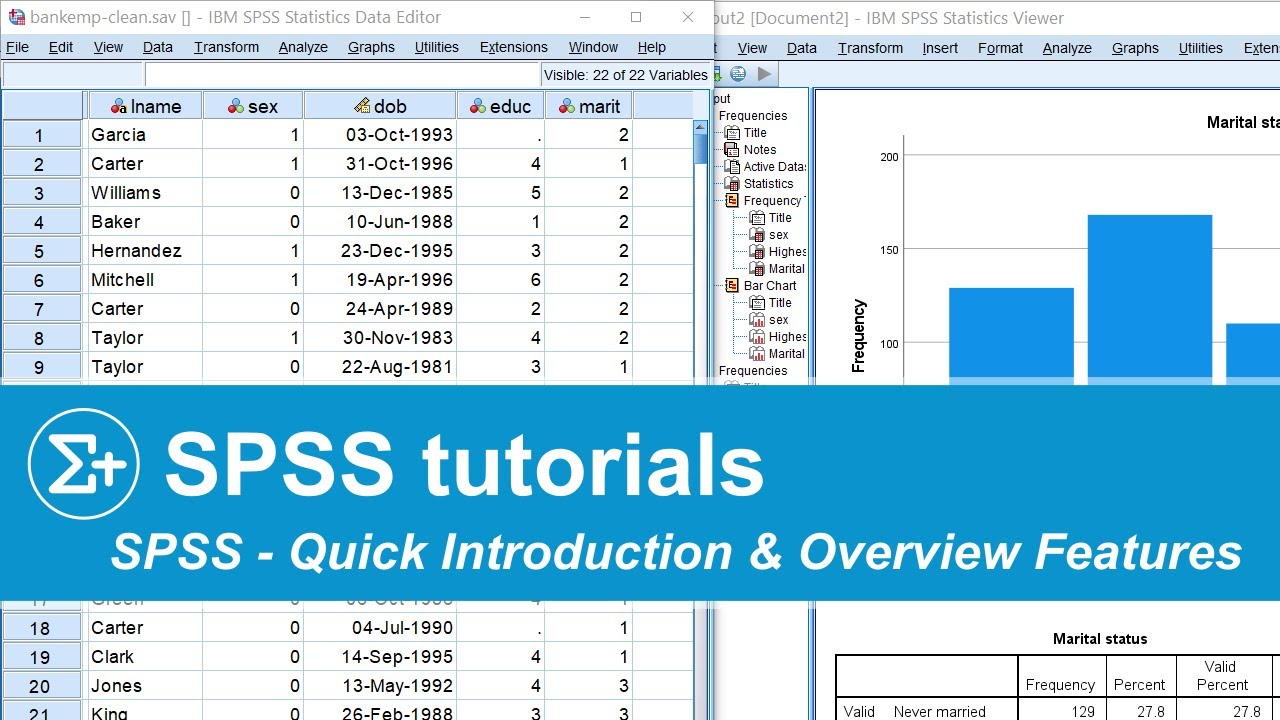
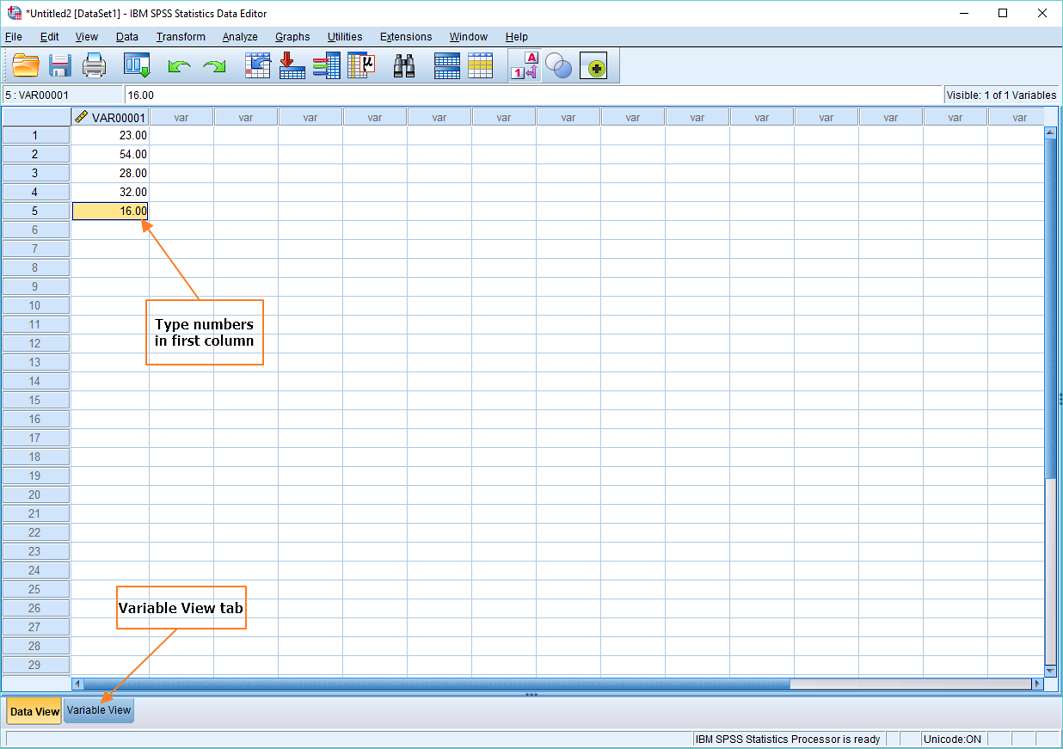
Understanding the SPSS Interface
Before diving into analysis, it’s important to understand the SPSS interface. Key components include:
- Data View: Where raw data is displayed in spreadsheet format.
- Variable View: Where you define properties like variable names, types, labels, and measurement scales.
- Output Viewer: Displays the results of statistical analyses.
- Syntax Editor: For users who prefer command-based data manipulation.
Familiarity with these areas can greatly enhance your efficiency and accuracy.
Importing and Managing Data in SPSS
SPSS allows users to import data from multiple sources:
- Excel spreadsheets (.xls, .xlsx)
- CSV files (.csv)
- Text files (.txt)
- SQL databases
To import data:
- Go to File > Open > Data.
- Select your file format.
- Adjust variable types and labels in Variable View.
Once your data is imported, you can use sorting, filtering, and recoding functions to manage it.
Data Cleaning and Preparation in SPSS
Before running analyses, data must be cleaned and prepared:
- Identify and handle missing values.
- Remove duplicates.
- Ensure consistency in variable types.
- Create new variables using transformations.
Clean data leads to more accurate and trustworthy results.
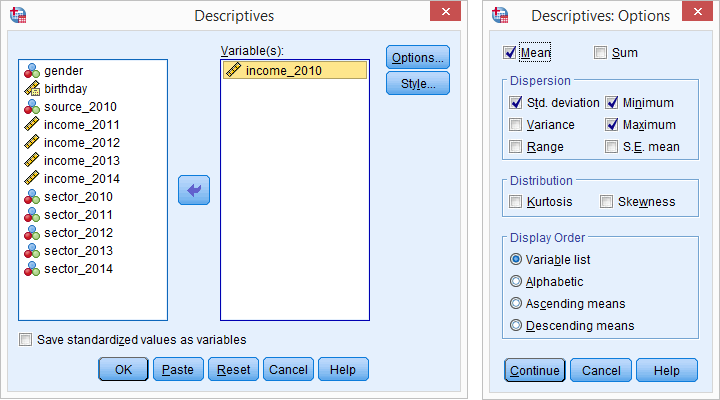
Descriptive Statistics in SPSS
Descriptive statistics summarize your data and provide key insights. Common techniques include:
- Mean, median, and mode
- Standard deviation and variance
- Frequency distributions
- Cross-tabulations
To access these:
- Go to Analyze > Descriptive Statistics
These tools are essential for getting a clear overview of your dataset.
Choosing the Right Statistical Test
SPSS offers a wide range of statistical tests. Choosing the right one depends on:
- Type of data (nominal, ordinal, interval, ratio)
- Number of groups being compared
- Research hypothesis
Common tests include:
- T-tests: Compare means between two groups.
- ANOVA: Compare means among three or more groups.
- Chi-square tests: Assess relationships between categorical variables.
- Correlation and regression: Explore relationships between continuous variables.
Interpreting SPSS Output
SPSS outputs are detailed but can be overwhelming. Key things to look for:
- P-values: Indicate statistical significance (commonly < 0.05).
- Confidence intervals: Show the range within which the true value lies.
- Effect size: Measures the strength of a relationship.
- Tables and charts: Visual representations help explain the data.
Understanding how to read output tables is essential for reporting results.
Creating Professional Reports in SPSS
SPSS makes it easy to create polished, exportable reports:
- Tables: Use pivot tables and format them for clarity.
- Graphs: Bar charts, histograms, scatterplots, and more.
- Exporting: Output can be exported to Word, PDF, or Excel.
- APA style: Reports can be formatted to meet academic standards.
Professional reporting ensures your analysis is both credible and presentable.
Common Challenges and Troubleshooting
While SPSS is user-friendly, beginners often face challenges:
- Missing or incorrect variable labels
- Incorrect measurement scales
- Unexpected null results
- Output that’s difficult to interpret
To troubleshoot:
- Check variable types and formats.
- Consult SPSS forums or IBM documentation.
- Use the Syntax Editor for more control.
- Work with a sample dataset to practice before using your own data.
Conclusion
Understanding the basics of SPSS is a critical step toward becoming proficient in data analysis. From importing data to interpreting complex outputs, SPSS offers a streamlined solution for researchers and analysts. With its user-friendly interface and powerful statistical tools, SPSS remains a top choice for those looking to conduct meaningful and accurate data analysis.
Whether you are a student working on your thesis or a professional preparing market research, SPSS can save you time and improve the quality of your insights. Use this guide as a foundation, and continue exploring the many features and techniques SPSS has to offer.
Needs help with similar assignment?
We are available 24x7 to deliver the best services and assignment ready within 3-4 hours? Order a custom-written, plagiarism-free paper
