Understanding the SPSS Interface|2025
Understanding the SPSS Interface: A Comprehensive Guide
IBM SPSS Statistics is a powerful software suite widely used for statistical analysis in social science, market research, health sciences, and various other fields. Its user-friendly interface allows both novice and experienced users to perform complex data analyses with relative ease. Understanding the SPSS interface is crucial for effective data management and analysis. This guide provides an in-depth exploration of the SPSS interface, focusing on its key components and functionalities.Data For Development+2Wikipedia+2Vskills+2
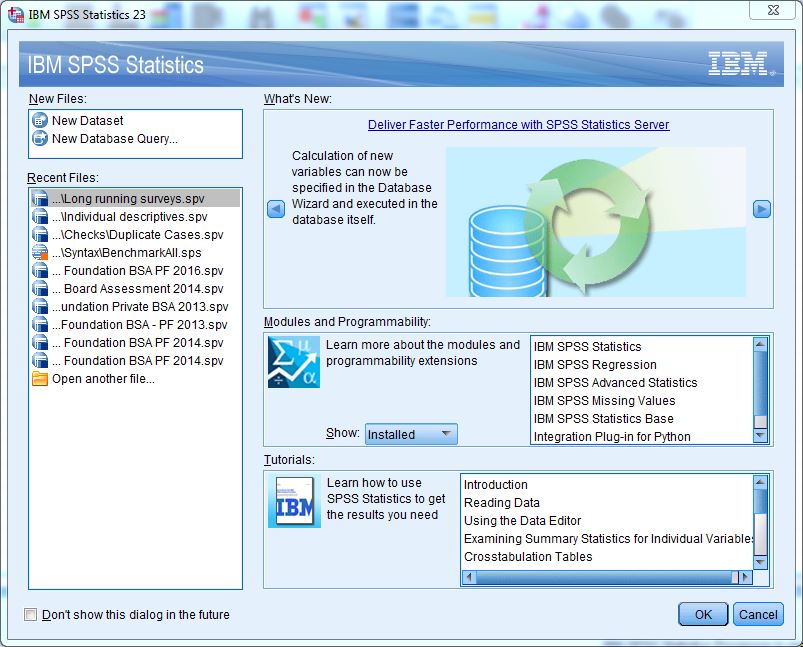
Overview of the SPSS Interface
Upon launching SPSS, users are greeted with a well-organized interface designed to streamline data analysis tasks. The main components of the interface include:
-
Menu Bar: Located at the top, it provides access to various functions such as file operations, data handling, analysis tools, and more.
-
Toolbar: Situated below the menu bar, it offers quick access to frequently used tools and commands.mindmajix
-
Data Editor: The central workspace where data is entered, viewed, and edited.
-
Output Viewer: Displays the results of analyses, including tables, charts, and statistical outputs.
-
Syntax Editor: Allows users to write and execute commands using SPSS syntax for advanced operations.
-
Pivot Table Editor: Enables customization and formatting of tables generated in the Output Viewer.Vskills+4Social Science Computing Cooperative+4Academia+4
-
Chart Editor: Facilitates the creation and modification of graphical representations of data.
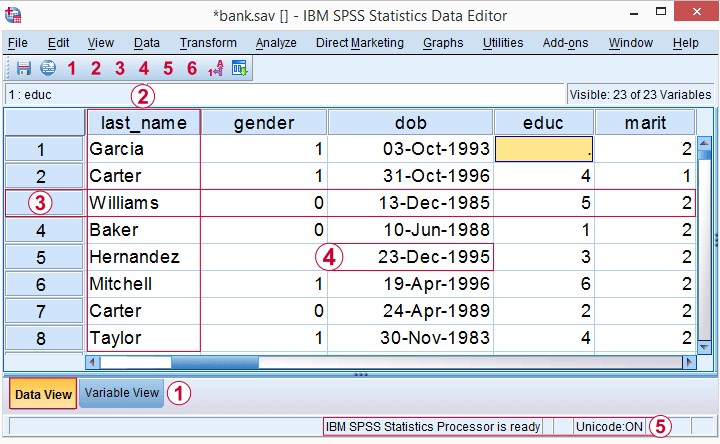
The Data Editor Window
The Data Editor is the primary workspace in SPSS, where users input and manipulate data. It comprises two main views:UniSA Login+2Vskills+2users.ssc.wisc.edu+2UniSA Login+1Wikipedia+1
Data View
In the Data View, data is displayed in a spreadsheet format:Kent State University Libraries+2Wikipedia+2Vskills+2
-
Rows: Represent individual cases or observations.Wikipedia+1Kent State University Libraries+1
-
Columns: Correspond to variables measured across all cases.Berkeley iSchool Courses+2Studeersnel+2Wikipedia+2
Each cell in the Data View represents a data point for a specific case and variable. Users can enter, edit, and navigate through data efficiently in this view.Vskills+3Social Science Statistics+3Wikipedia+3
Variable View
The Variable View provides metadata about the dataset:
-
Name: The identifier for each variable.
-
Type: Specifies the data type (e.g., numeric, string).
-
Width: Determines the number of characters for string variables.
-
Decimals: Sets the number of decimal places for numeric variables.
-
Label: A descriptive label for the variable.
-
Values: Defines value labels for categorical variables.studylib.net
-
Missing: Identifies missing data codes.Berkeley iSchool Courses
-
Columns: Adjusts the width of the variable column in the Data View.
-
Align: Sets the alignment of variable values.
-
Measure: Indicates the level of measurement (Nominal, Ordinal, Scale).Studeersnel+1Berkeley iSchool Courses+1
This view is essential for defining and managing the structure of the dataset.

The Output Viewer
The Output Viewer displays the results of analyses performed in SPSS. It consists of two main sections:Social Science Computing Cooperative+2Vskills+2users.ssc.wisc.edu+2Social Science Computing Cooperative+1Vskills+1
-
Outline Pane: Provides a hierarchical view of the output, allowing users to navigate through different sections easily.
-
Display Pane: Shows the actual output, including tables, charts, and statistical results.
Users can interact with the output by double-clicking objects to edit them, rearranging items, or exporting results for reporting purposes.
The Syntax Editor
For advanced users, the Syntax Editor offers a command-line interface to write and execute SPSS syntax. Syntax allows for:UniSA Login
-
Reproducibility: Ensures analyses can be repeated with the same commands.
-
Automation: Facilitates the automation of repetitive tasks.
-
Complex Operations: Enables the execution of complex data manipulations and analyses not accessible through the graphical interface.Wikipedia
The Syntax Editor is particularly useful for handling large datasets and performing batch processing.
The Pivot Table Editor
The Pivot Table Editor allows users to customize the appearance and layout of tables generated in the Output Viewer:Vskills+1Academia+1
-
Rearranging Rows and Columns: Users can drag and drop elements to reorganize the table structure.
-
Formatting: Adjusts fonts, colors, and styles to enhance readability.
-
Summarizing Data: Applies summary statistics to data within the table.
This editor is essential for preparing tables for presentation or publication.
The Chart Editor
The Chart Editor provides tools to create and modify graphical representations of data:
-
Chart Types: Users can select from various chart types, including bar charts, histograms, pie charts, and scatterplots.
-
Customization: Adjusts elements such as titles, axis labels, legends, and colors.
-
Data Series: Modifies the data series displayed in the chart.
Effective use of the Chart Editor enhances the visual appeal and clarity of data presentations.
Working with Data in SPSS (continued)
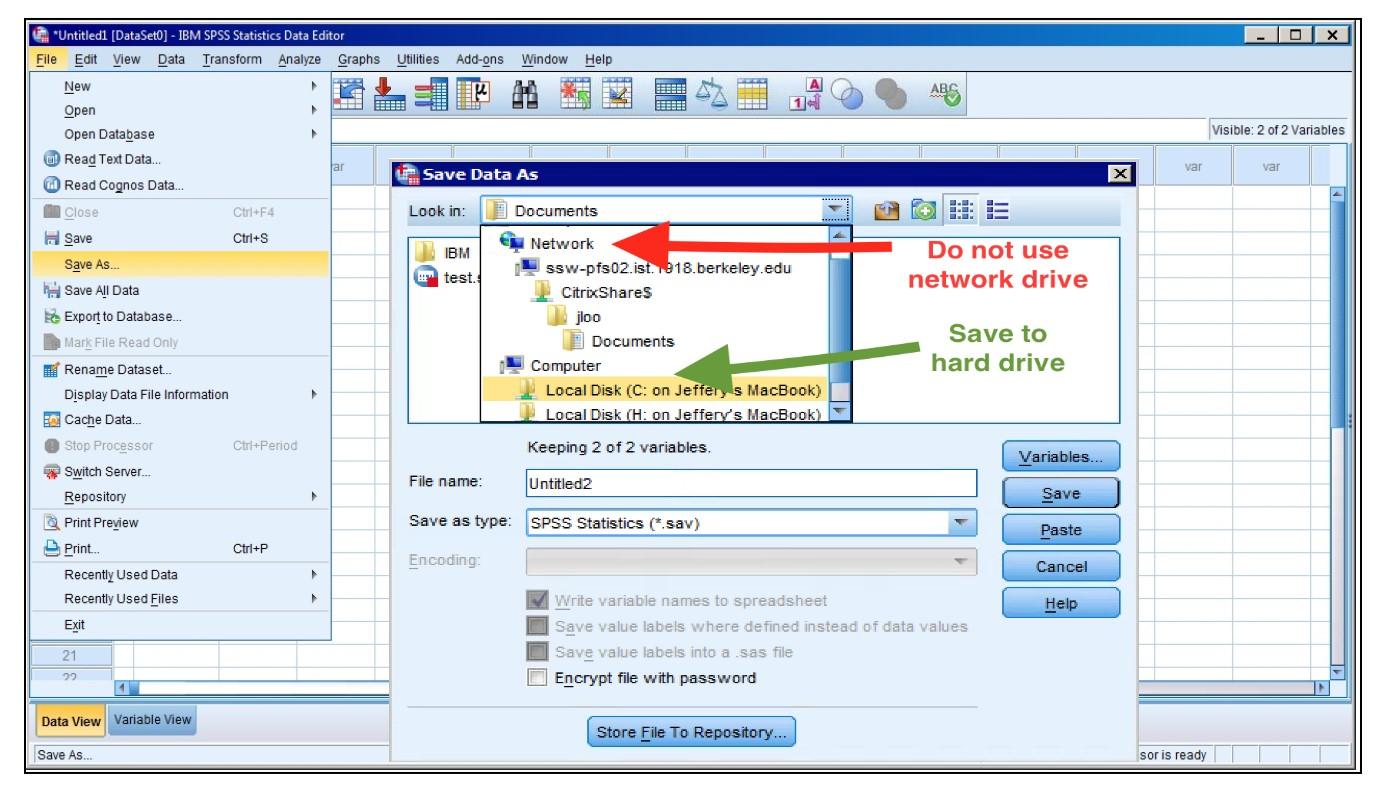
Importing and Exporting Data
SPSS supports various data formats, making it versatile for different research needs:
-
Import Options:
-
Excel files (.xls, .xlsx)
-
CSV (.csv)
-
Text files (.txt, .dat)
-
SAS, STATA, and other statistical formats
-
Database connections (e.g., SQL)
-
When importing, SPSS provides a preview pane and field-mapping options to ensure variables align correctly.
-
Export Options:
-
Exporting results to Excel, PDF, or Word
-
Saving datasets in different formats for use in other tools
-
This interoperability is crucial for collaboration and integrating SPSS into broader workflows.
Data Cleaning and Preparation
Data cleaning is a fundamental task before any analysis. SPSS offers tools to:
-
Identify missing values
-
Recode variables
-
Compute new variables
-
Sort and filter data
-
Detect outliers
These features are accessible through both menus and syntax, offering flexibility depending on user preference.
Data Transformation
SPSS simplifies data transformation through:
-
Recode into Same or Different Variables
-
Compute Variable for creating new fields using mathematical expressions
-
Rank Cases, Aggregate, and Split Files for grouped analyses
Such features are especially helpful when dealing with large or complex datasets.
Running Analyses in SPSS
SPSS’s analytical tools are its core strength. Users can perform a wide range of statistical analyses:
Descriptive Statistics
This includes:
-
Frequencies
-
Descriptive (mean, standard deviation)
-
Explore
-
Crosstabs
Useful for getting an overview of your data.
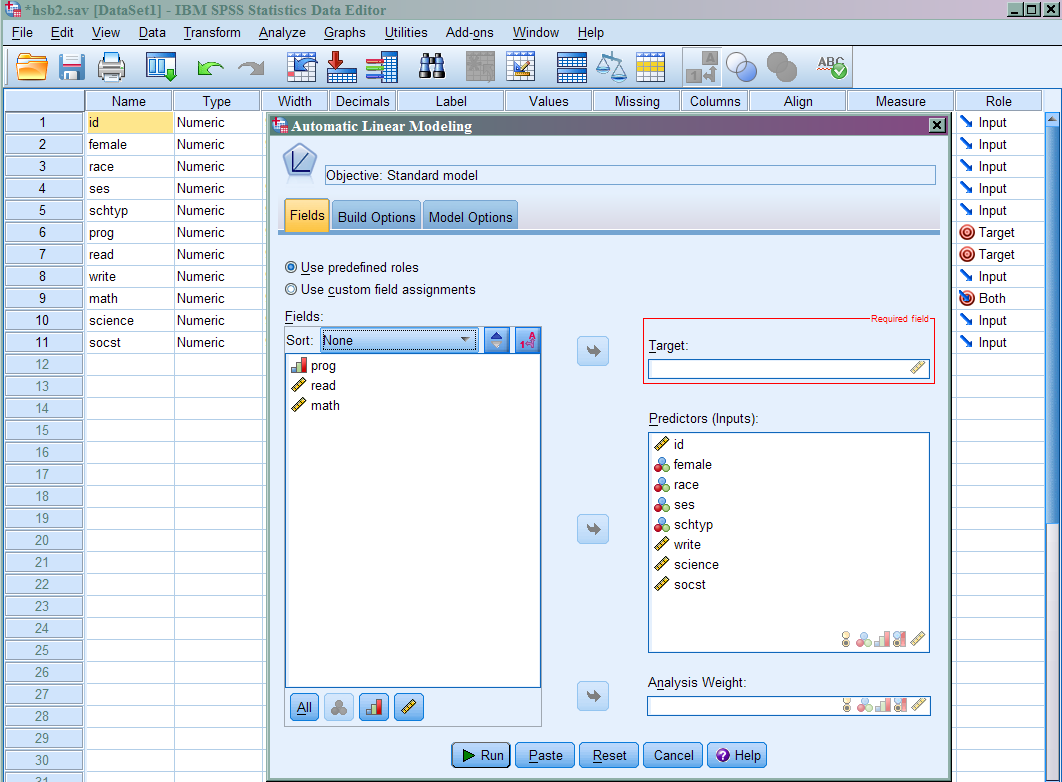
Inferential Statistics
SPSS supports:
-
T-tests (one-sample, paired, independent)
-
ANOVA (one-way, two-way)
-
Chi-square tests
-
Correlation (Pearson, Spearman)
-
Regression (linear, logistic)
Each analysis opens a dialog box with intuitive prompts for selecting dependent and independent variables.
Nonparametric Tests
Ideal when data doesn’t meet parametric assumptions, SPSS offers:
-
Mann-Whitney U
-
Kruskal-Wallis
-
Wilcoxon Signed-Rank
-
Friedman Test
These are accessible via the “Nonparametric Tests” menu.
Advanced Statistics
SPSS also includes modules for:
-
Factor Analysis
-
Cluster Analysis
-
Discriminant Analysis
-
Multivariate Analysis (MANOVA)
These features are essential for deeper, multivariate interpretations and modeling.
Challenges in Understanding the SPSS Interface
Despite its power and versatility, many users—especially beginners—face challenges when navigating SPSS.
Steep Learning Curve
While SPSS is GUI-driven, its complexity can overwhelm new users. The sheer number of menus and options makes it easy to get lost.
-
Confusion between Data View and Variable View
-
Difficulty interpreting Output Viewer
-
Limited familiarity with statistical concepts required to choose the right analysis
Syntax Versus GUI
New users tend to rely heavily on the GUI, avoiding syntax due to its perceived complexity. However:
-
Some advanced operations are only available through syntax.
-
Users who avoid learning syntax may struggle to automate processes or replicate analyses.
Encouraging a gradual introduction to syntax can help bridge this gap.
Output Management
The Output Viewer can quickly become cluttered, making it difficult to interpret or organize results.
-
Users may not understand how to edit or format pivot tables.
-
Exporting and copying results into reports can be non-intuitive at first.
Chart and Table Customization
Although customization is possible via the Chart and Pivot Table Editors, the process can be tedious and confusing without practice.
-
Too many formatting options without clear guidance
-
Limited defaults for professional-quality output
Software Limitations and Bugs
At times, SPSS may crash during large analyses, particularly with older machines or extensive syntax files. Other usability concerns include:
-
Lack of real-time collaboration features
-
No autosave for syntax or outputs
-
Clunky integration with modern platforms (e.g., cloud storage)
Strategies to Overcome Interface Challenges
Structured Learning
Investing time in a structured SPSS course—either self-paced online or instructor-led—can significantly reduce the learning curve. Good courses cover:
-
Basic interface navigation
-
Data management
-
Fundamental and advanced statistical procedures
-
Syntax writing
Practice with Real Datasets
Using sample datasets allows users to get hands-on experience without worrying about “breaking” anything. SPSS includes built-in examples such as:
-
demo.sav
-
employee data
-
market research surveys
These can be accessed via File > Open > Data > Samples Folder.
Tutorials and Documentation
IBM provides extensive documentation and user manuals. Additionally, online communities, forums, and YouTube channels offer free tutorials on:
-
Data entry
-
Common analyses
-
Output interpretation
-
Chart editing
Combine GUI and Syntax
Using the GUI to generate syntax (by selecting Paste instead of OK) is a good way to learn SPSS commands gradually. This hybrid approach lets users:
-
Understand the logic behind commands
-
Edit commands for reuse
-
Build confidence to write syntax from scratch
Customize Environment
Users can make the SPSS interface easier to navigate by:
-
Customizing toolbars
-
Setting default directories for file saving
-
Using templates for charts and tables
These small adjustments help streamline workflows.
Best Practices for Efficient SPSS Use
Save Often and Organize Files
SPSS doesn’t autosave syntax or output files. Always:
-
Save your syntax frequently
-
Keep datasets, syntax files, and outputs in organized folders
-
Name variables and files clearly
Use Syntax Logs
Maintain a log of all syntax used during a project. This provides:
-
A clear trail for reproducibility
-
An easy way to troubleshoot errors
Validate Data Before Analysis
Always:
-
Check for missing data
-
Verify variable types and labels
-
Use Descriptives to ensure values are in expected ranges
Document Your Work
Use the COMMENT command in syntax or include comments in output reports to explain decisions and methods.
The Future of SPSS and User Interface Improvements
As statistical software evolves, IBM continues to update SPSS to improve usability. Recent updates include:
-
Enhanced chart builder
-
Improved syntax editor with syntax highlighting
-
Better integration with R and Python
Still, many users advocate for:
-
A modernized interface
-
Real-time collaboration tools
-
More intuitive customization options
Open-source competitors like RStudio and Jamovi continue to attract users due to their flexibility and user-friendly design.
Conclusion
Understanding the SPSS interface is essential for harnessing its powerful statistical tools. While its layout and menu-driven structure are designed for accessibility, they still pose significant challenges, especially for beginners. Navigating the Data Editor, Output Viewer, Syntax Editor, and customization tools takes time and practice.
To overcome these challenges, users should blend structured learning with hands-on experimentation, gradually incorporating syntax into their workflow. By investing in understanding SPSS’s interface and capabilities, researchers and analysts can unlock its full potential and conduct more accurate, efficient, and reproducible analyses.
Needs help with similar assignment?
We are available 24x7 to deliver the best services and assignment ready within 3-4 hours? Order a custom-written, plagiarism-free paper
