What is Statistical Analysis in a Dissertation?|2025
/in General Articles /by BesttutorDiscover What is Statistical Analysis in a Dissertation? Learn how to apply statistical methods to interpret data, support your research findings, and enhance the quality of your dissertation.
Statistical analysis is an essential part of many research projects, especially dissertations, as it involves the use of various statistical methods to analyze and interpret data. This paper aims to explore what statistical analysis entails in the context of a dissertation, providing examples of how it is applied and outlining the different methods commonly used. Additionally, the paper will discuss how to write statistical analysis in a research paper, with a focus on five basic methods of statistical analysis and their importance in research. Examples and relevant links to resources, such as “Statistical analysis PDF” and data analysis dissertation examples, will also be provided to support the understanding of these concepts.
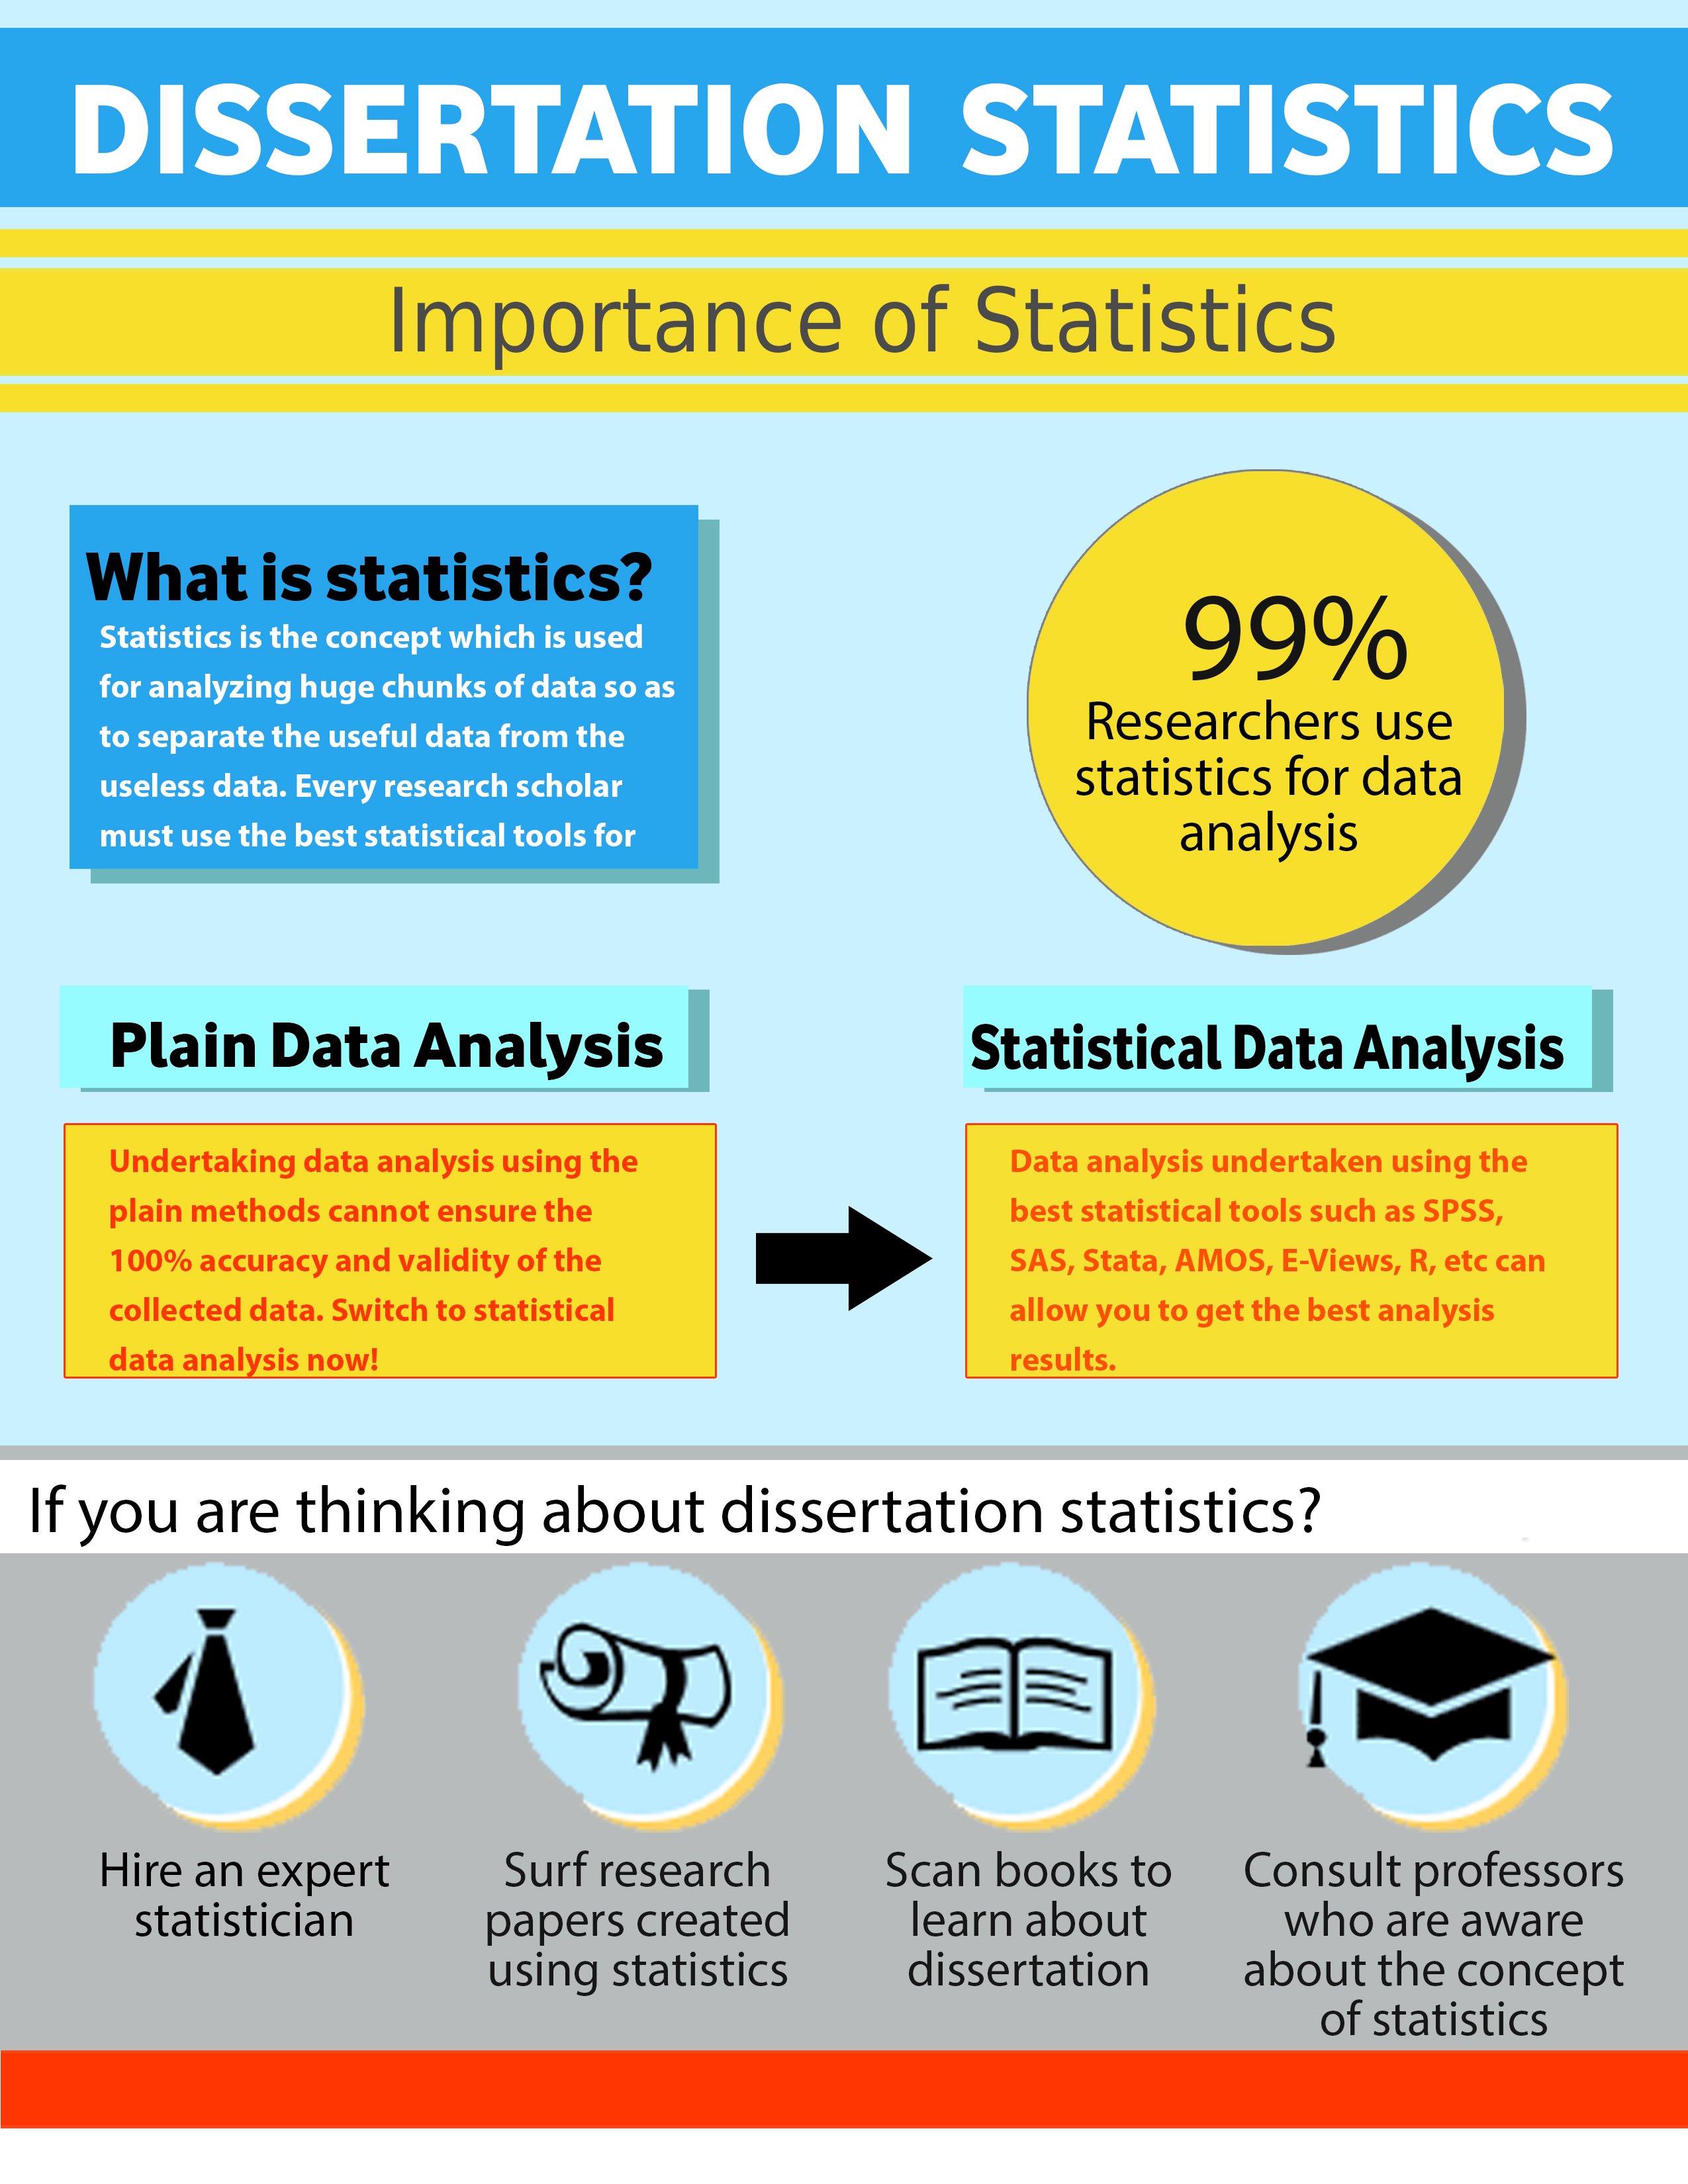
Table of Contents
ToggleWhat is Statistical Analysis in a Dissertation?
Statistical analysis in a dissertation refers to the application of statistical methods to collect, organize, analyze, and interpret data in order to answer research questions or test hypotheses. This process involves using numerical data to draw conclusions, make predictions, or assess relationships between variables. A dissertation often includes a section dedicated to statistical analysis to demonstrate the researcher’s ability to handle data and present findings in a clear, systematic manner.
In a dissertation, statistical analysis serves as the backbone of the empirical investigation. It helps to validate or challenge the research hypotheses, provide evidence to support conclusions, and ensure the results are scientifically rigorous. The analysis typically involves processing raw data through various statistical tools and methods, followed by interpreting the outcomes and relating them to the research questions.
Statistical Analysis Examples
To better understand how statistical analysis is applied in a dissertation, let’s explore a few examples:
Example 1: Correlation Analysis
Suppose a dissertation is focused on examining the relationship between students’ study hours and their academic performance. A researcher may collect data on the number of hours students spend studying each week and their corresponding grades. The researcher could then perform a correlation analysis to assess the strength and direction of the relationship between study hours and academic performance.
Example 2: Regression Analysis
Another example could be a dissertation on the impact of advertising spend on sales revenue for a company. The researcher might use regression analysis to determine how changes in the amount of money spent on advertising influence sales. Regression analysis helps in predicting the dependent variable (sales) based on one or more independent variables (advertising spend).
Example 3: T-Tests or ANOVA
In a dissertation studying the effectiveness of different teaching methods, a researcher could use t-tests or Analysis of Variance (ANOVA) to compare the academic performance of students who were taught using different methods. These statistical tests help to assess whether there are significant differences between groups, which is crucial in understanding the impact of varying factors.
These examples demonstrate the diverse ways statistical analysis can be applied in dissertations to explore relationships, differences, or patterns in data.

How to Write Statistical Analysis in Research Paper
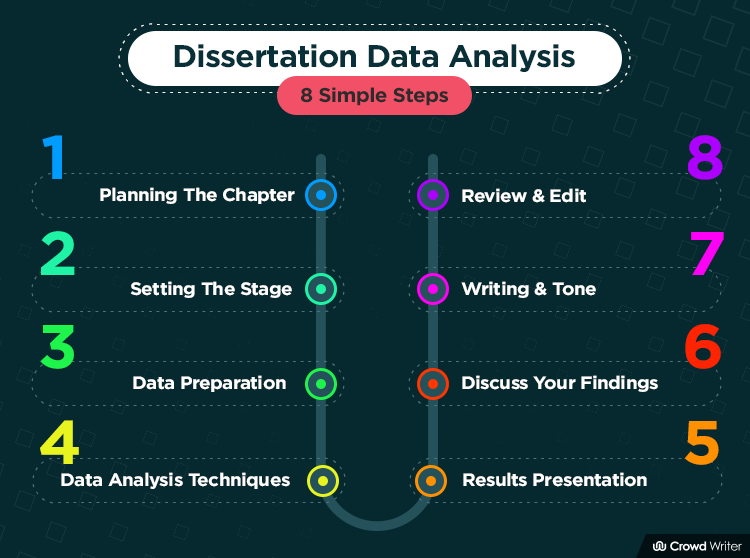
Writing statistical analysis in a research paper involves several key steps to ensure clarity and comprehensiveness:
Describing the Data
The first step is to describe the data collected for the research. This includes outlining the variables, the scale of measurement (nominal, ordinal, interval, ratio), and the sample size. It is important to present the data in a clear and organized manner to ensure that readers can easily follow the analysis process.
Choosing the Appropriate Statistical Methods
The next step is to determine the most suitable statistical methods for analyzing the data. This decision depends on the research questions, the type of data, and the research design. Common statistical methods include descriptive statistics, correlation analysis, regression analysis, t-tests, ANOVA, and chi-square tests. Each method has specific applications and should be chosen based on the research objectives.
Performing the Analysis
After selecting the appropriate methods, the researcher performs the analysis using statistical software such as SPSS, R, or Excel. The results of the analysis are then presented in the form of tables, graphs, or charts to make the findings more accessible to the reader.
Interpreting the Results
Once the analysis is complete, the researcher must interpret the results in the context of the research questions. This involves explaining the meaning of the statistical outcomes, identifying any significant findings, and discussing their implications for the research.
Reporting the Findings
The final step is to report the statistical analysis findings in the results section of the dissertation. This section should clearly present the analysis, including statistical values (e.g., p-values, coefficients, and confidence intervals), and provide an interpretation of the results in relation to the research hypothesis.
5 Basic Methods of Statistical Analysis
Statistical analysis encompasses a wide range of methods, but five basic methods are commonly used in research:
Descriptive Statistics
Descriptive statistics summarize and describe the main features of a dataset. These include measures such as the mean, median, mode, standard deviation, and range. Descriptive statistics provide an overview of the data and are typically used to present basic characteristics of the sample or population.
Correlation Analysis
Correlation analysis is used to examine the relationship between two or more variables. The most common measure of correlation is Pearson’s correlation coefficient, which indicates the strength and direction of the relationship between variables. Correlation analysis helps researchers determine whether changes in one variable are associated with changes in another.
Regression Analysis
Regression analysis allows researchers to model the relationship between a dependent variable and one or more independent variables. It is commonly used for prediction and understanding the impact of different factors on the outcome variable. Simple linear regression models the relationship between two variables, while multiple regression models involve more complex relationships.
T-Tests and ANOVA
T-tests and ANOVA are used to compare the means of two or more groups. T-tests are typically used when comparing two groups, while ANOVA is used for comparing more than two groups. These tests help to determine if there are significant differences between groups in terms of their means.
Chi-Square Tests
Chi-square tests are used to analyze categorical data and assess whether there is a significant association between two or more categorical variables. This method is often used in surveys and experiments where the data is in the form of counts or frequencies.
Statistical Analysis Methods
In addition to the five basic methods mentioned above, several other statistical analysis methods are frequently used in research. These include:
Factor Analysis
Factor analysis is used to identify underlying relationships between a large number of variables by grouping them into factors. It is particularly useful in exploring complex datasets and reducing dimensionality.
Multivariate Analysis
Multivariate analysis involves the analysis of multiple variables simultaneously to understand the relationships and interactions between them. Techniques such as MANOVA (Multivariate Analysis of Variance) and principal component analysis (PCA) are commonly used in multivariate analysis.
Survival Analysis
Survival analysis is used to examine the time it takes for a specific event to occur, such as death, disease relapse, or product failure. It is often applied in fields such as healthcare and engineering.
Bayesian Statistics
Bayesian statistics is a statistical approach that involves updating the probability of a hypothesis as more evidence becomes available. It is increasingly popular in various fields due to its flexibility and ability to incorporate prior knowledge into the analysis.

Statistical Analysis PDF and Data Analysis Dissertation Example
For those interested in learning more about statistical analysis, several resources are available online, including free statistical analysis PDFs and sample dissertations that demonstrate how to conduct and present statistical analysis in a dissertation. These resources can provide practical examples and guide researchers through the process of data analysis.
One such example could be a data analysis dissertation example, where the statistical analysis section is detailed with clear explanations of the methods used and the findings. These examples help researchers understand how to structure their statistical analysis and report their results effectively.
Conclusion
Statistical analysis is a crucial aspect of writing a dissertation, as it provides the necessary tools to interpret and present data in a meaningful way. By understanding the various statistical methods available and how to apply them in a research context, researchers can ensure that their findings are accurate, reliable, and scientifically valid. Whether it is through correlation, regression, or ANOVA, statistical analysis helps to provide insights and answers to the research questions posed in the dissertation. As researchers continue to explore the best ways to analyze data, the methods and tools available will evolve, but the core principles of statistical analysis will remain fundamental to producing high-quality, evidence-based research.
Needs help with similar assignment?
We are available 24x7 to deliver the best services and assignment ready within 3-4 hours? Order a custom-written, plagiarism-free paper
