Reporting One-Way ANOVA Test in SPSS: A Complete Guide for Accurate Data Analysis|2025
Get expert help with Reporting One-Way ANOVA Test in SPSS. Learn how to conduct the analysis, interpret results, and present your findings accurately with step-by-step guidance.
The One-Way ANOVA (Analysis of Variance) test is a statistical method used to compare the means of three or more independent groups to determine if there are significant differences among them. It is widely used in research and data analysis to evaluate hypotheses related to the effects of a categorical independent variable on a continuous dependent variable. Performing the One-Way ANOVA test in SPSS (Statistical Package for the Social Sciences) is a common practice for students, researchers, and professionals who wish to draw valid conclusions from their data.
This article provides a detailed guide on how to conduct and report the results of a One-Way ANOVA test in SPSS, ensuring that the findings are accurately presented and interpreted. By focusing on common reporting standards and clear instructions on how to generate and present output, this guide is aimed at improving the effectiveness of your data analysis and ensuring that you meet academic or professional standards.
With the high volume of searches for “One-Way ANOVA in SPSS,” “how to report One-Way ANOVA,” and related keywords, this article will focus on the steps involved in performing the test, interpreting the results, and reporting them in an understandable and professional manner. Whether you are working on a research project, dissertation, or any data analysis assignment, this article will serve as a valuable resource to ensure that you can confidently report your findings.
What is One-Way ANOVA?
Before diving into how to report the results of the One-Way ANOVA test, it’s essential to understand the core concept of the test itself.
One-Way ANOVA is a statistical technique used when you have one independent variable with three or more levels (groups) and a continuous dependent variable. It helps to determine if there is a statistically significant difference between the means of these groups. The key assumption of One-Way ANOVA is that the samples are independent, the data is normally distributed, and the variances across the groups are equal (homogeneity of variances).
When to Use One-Way ANOVA
The One-Way ANOVA test is particularly useful when comparing multiple groups or treatments in experimental research, such as comparing different teaching methods, drug treatments, or performance levels. For example, researchers may want to compare the effectiveness of three different marketing strategies to determine which one produces the best results.
The One-Way ANOVA assesses the null hypothesis that all group means are equal. If the p-value is below a specified threshold (usually 0.05), the null hypothesis is rejected, indicating that at least one group mean differs significantly from the others. However, this does not indicate which groups are different, which is why a post-hoc test is often conducted if the ANOVA result is significant.
Performing One-Way ANOVA in SPSS
SPSS is a powerful tool for statistical analysis, and it provides an intuitive interface for running the One-Way ANOVA test. The following steps guide you through the process of conducting the test in SPSS.
Step 1: Preparing the Data
Before performing the One-Way ANOVA test, your data needs to be formatted appropriately. Each observation in your dataset should consist of two variables:
- Independent Variable (Factor): A categorical variable with three or more levels (groups).
- Dependent Variable: A continuous variable that represents the measurement you wish to analyze.
For example, if you are testing the effect of three different diets on weight loss, the independent variable would be the type of diet (with three levels: diet A, diet B, and diet C), and the dependent variable would be the weight loss measurement.
Step 2: Running One-Way ANOVA
- Open SPSS and load your dataset.
- From the top menu, click Analyze → Compare Means → One-Way ANOVA.
- A dialog box will appear. In the Dependent List box, move the dependent variable (e.g., weight loss) into the box. In the Factor box, move the independent variable (e.g., diet type) into the box.
- If you have specific hypotheses about which groups might differ, you can click on Post Hoc and select the appropriate test (e.g., Tukey, Bonferroni).
- You can also check the Options button to request descriptive statistics, means plots, and homogeneity tests.
- Finally, click OK to run the test.
Step 3: Interpreting the SPSS Output
Once the analysis is complete, SPSS will generate an output file that contains several tables. The key tables to focus on when reporting One-Way ANOVA results are:
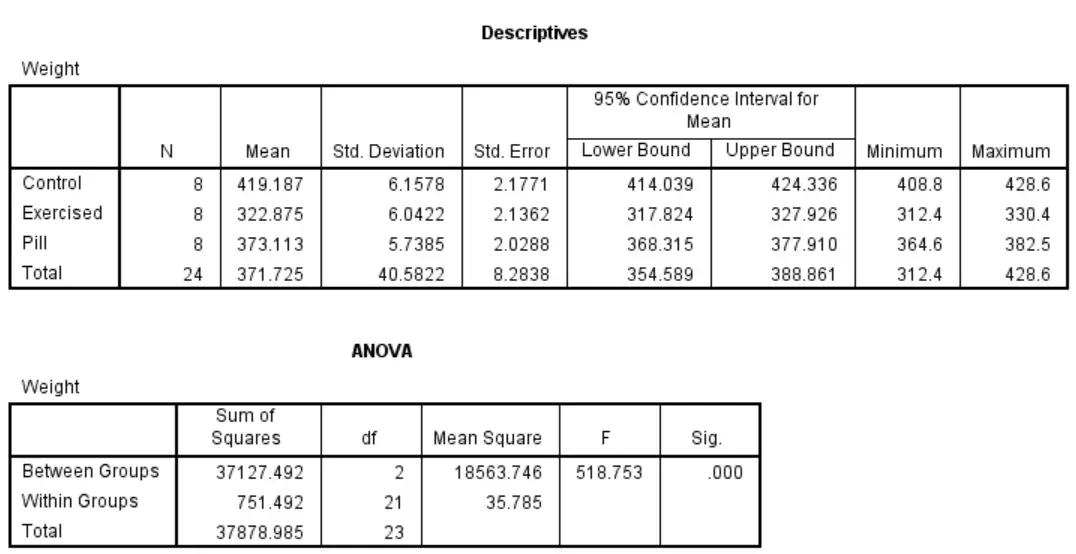
- Descriptive Statistics Table: This table provides the mean, standard deviation, and sample size for each group.
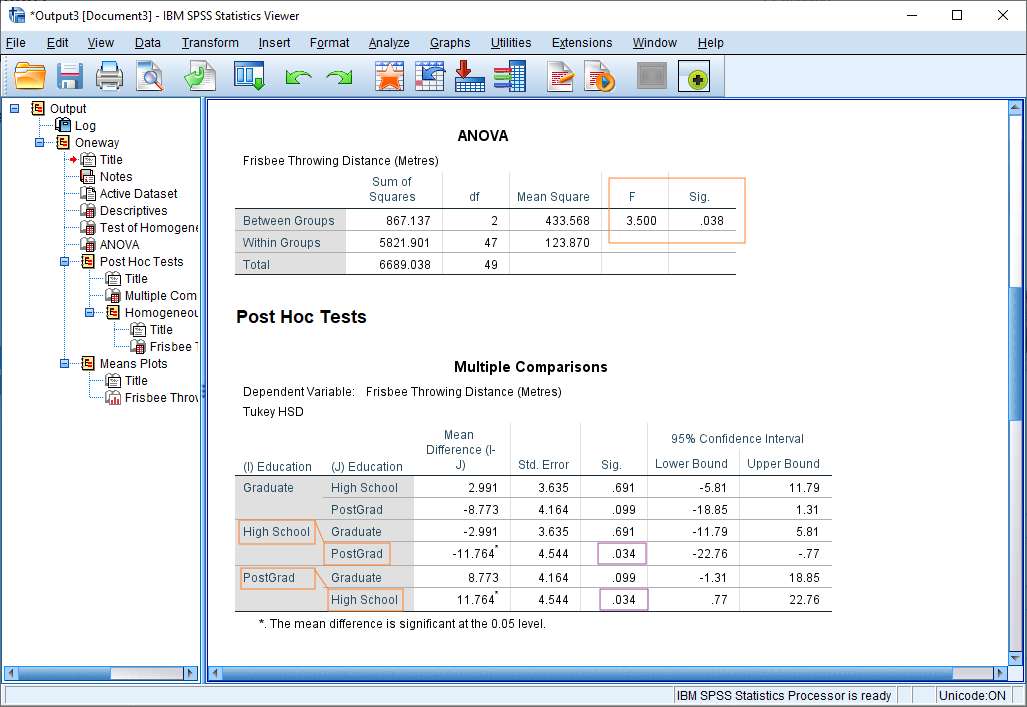
- ANOVA Table: This is the main result table. It contains the F-value, degrees of freedom (df), p-value, and eta squared value.
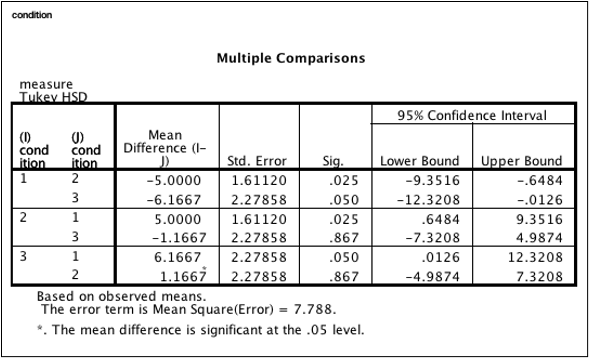
- Post-Hoc Test Results (if applicable): These tests identify which specific group means differ from one another.
Reporting One-Way ANOVA Results in SPSS
When reporting the results of a One-Way ANOVA in SPSS, it’s important to present the findings clearly and in a format that adheres to academic standards. Here are the key elements you should include in your report:
Descriptive Statistics
Begin by reporting the descriptive statistics for each group, which include the mean, standard deviation, and sample size. This provides a summary of the data before diving into the statistical tests.
Example Report: The three diet groups (A, B, and C) were compared for their effects on weight loss. The mean weight loss for diet A was 5.2 kg (SD = 1.1), for diet B was 4.8 kg (SD = 0.9), and for diet C was 6.1 kg (SD = 1.4).
Results of One-Way ANOVA
Next, you should report the ANOVA results. Focus on the F-statistic, degrees of freedom, and p-value. If the p-value is less than the chosen alpha level (usually 0.05), you can conclude that there is a significant difference between the group means.
Example Report: A One-Way ANOVA was conducted to determine if there were significant differences in weight loss among the three diet groups. The results showed that there was a statistically significant difference between the groups, F(2, 87) = 4.52, p = 0.014.
Post-Hoc Comparisons
If the One-Way ANOVA result is significant, you should perform post-hoc tests (e.g., Tukey or Bonferroni) to identify which specific groups differ from one another. Report the p-values for the pairwise comparisons.
Example Report: Post-hoc comparisons using the Tukey HSD test indicated that diet A (M = 5.2, SD = 1.1) resulted in significantly greater weight loss than diet B (M = 4.8, SD = 0.9), p = 0.012. However, no significant difference was found between diet A and diet C (M = 6.1, SD = 1.4), p = 0.225, or between diet B and diet C, p = 0.103.
Reporting Effect Size
Effect size, often measured by eta squared (η²), provides information on the practical significance of the results. It indicates how much variance in the dependent variable is explained by the independent variable.
Example Report: The effect size was calculated using eta squared (η²), which revealed that the independent variable (diet type) explained 9.4% of the variance in weight loss, indicating a moderate effect size.
Conclusion
Finally, provide a conclusion based on the results of the One-Way ANOVA and post-hoc tests. Summarize whether the hypothesis was supported and the implications of the findings.
Example Report: In conclusion, the results of the One-Way ANOVA suggest that diet type has a significant effect on weight loss. Specifically, diet A was found to be more effective than diet B, while diet C did not differ significantly from the other two. These findings suggest that diet A may be the most effective choice for weight loss among the three tested diets.
Common Mistakes to Avoid When Reporting One-Way ANOVA Results
When reporting the results of a One-Way ANOVA in SPSS, there are several common mistakes to avoid:
- Failing to Check Assumptions: Ensure that your data meet the assumptions of normality and homogeneity of variances before conducting the ANOVA. Violations of these assumptions can lead to inaccurate results.
- Reporting Only the P-Value: Avoid simply reporting the p-value without context. Always include the F-value, degrees of freedom, and effect size to provide a complete picture of your results.
- Overlooking Post-Hoc Tests: If your ANOVA is significant, remember to conduct and report post-hoc tests to determine which groups differ.
- Misinterpreting Non-Significant Results: A non-significant result means there is no evidence to reject the null hypothesis. Do not interpret it as proof that the groups are the same, as a larger sample size or different methodology may yield different results.
Conclusion
Reporting One-Way ANOVA results in SPSS requires careful attention to detail and a thorough understanding of statistical concepts. By following the steps outlined in this guide, you can ensure that your findings are accurately reported, adhering to best practices in data analysis. SPSS provides an intuitive interface for running the test, and with proper interpretation of the output, you can confidently present your results in a clear and meaningful way.
Whether you are conducting research for a dissertation, academic assignment, or professional project, this guide has equipped you with the necessary skills to report One-Way ANOVA results effectively. By understanding the underlying principles, conducting the analysis properly, and interpreting and presenting the results accurately, you will be able to draw valid conclusions and make informed decisions based on your data.
Needs help with similar assignment?
We are available 24x7 to deliver the best services and assignment ready within 3-4 hours? Order a custom-written, plagiarism-free paper
