The SUM Function in Excel|2025

Discover how to use the SUM function in Excel to quickly add up numbers and streamline your calculations. Master this essential tool for efficient data analysis and productivity!

The SUM function in Excel is one of the most commonly used functions for performing mathematical calculations. It allows users to quickly add numbers from a range of cells, making data analysis and reporting more efficient. Whether you are summing a column, applying conditional summation, or using advanced summing techniques, the SUM function is a versatile tool that simplifies complex calculations.

The SUM Function in Excel

Understanding the SUM Function in Excel

The SUM function in Excel is a built-in function that calculates the total of a specified range of numbers. The syntax for the SUM function is:

=SUM(number1, [number2], ...)
  • number1, number2, etc., represent individual values or cell ranges.
  • The function can accept up to 255 arguments, including numbers, cell references, and ranges.

Example:

If you have numbers in cells A1 to A5 and want to calculate their sum, use the following formula:

=SUM(A1:A5)

How to Sum a Column in Excel

Summing an entire column in Excel is a common task. The easiest way to do this is by selecting a column and using the SUM function.

Steps to sum a column:

  1. Click on the cell where you want the sum to appear.
  2. Type =SUM( and then select the column range (e.g., A:A for column A).
  3. Press Enter to complete the formula.

Example:

=SUM(A:A)

This formula sums all numerical values in column A.

Note: Avoid using the entire column reference if there are non-numeric entries, as they may cause errors.

SUMIF Function in Excel

The SUMIF function in Excel allows users to sum values based on a specified condition. This is useful when summing only numbers that meet a specific criterion.

Syntax:

=SUMIF(range, criteria, [sum_range])
  • range – The range of cells to evaluate.
  • criteria – The condition to be met.
  • sum_range (optional) – The range of cells to sum if different from the evaluation range.

The SUM Function in Excel

Example:

If you want to sum sales in column B only for “Product A” listed in column A:

=SUMIF(A:A, "Product A", B:B)

This formula adds up values in column B where column A contains “Product A”.

Advanced SUM Function in Excel

Beyond basic summing, Excel provides advanced techniques to handle complex data analysis. Some advanced summing methods include:

Using SUM with Multiple Conditions (SUMIFS)

The SUMIFS function allows summing based on multiple criteria.

Syntax:

=SUMIFS(sum_range, criteria_range1, criteria1, [criteria_range2, criteria2], ...)

Example:

If you want to sum sales in column C for “Product A” in column A and “Region 1” in column B:

=SUMIFS(C:C, A:A, "Product A", B:B, "Region 1")

Summing Only Visible Cells

When dealing with filtered lists, the SUBTOTAL function can sum only visible cells.

Example:

=SUBTOTAL(9, A1:A10)

(The number 9 specifies the SUM operation in the SUBTOTAL function.)

Sum Function in Excel Multiple Cells

To sum multiple non-adjacent cells, you can specify each cell reference separately in the SUM function.

Example:

=SUM(A1, B3, C5, D7)

This formula adds the values in cells A1, B3, C5, and D7.

Another approach is summing multiple ranges:

=SUM(A1:A5, C1:C5)

This adds values from both ranges A1:A5 and C1:C5.

Excel SUM Formula Shortcut

Excel provides keyboard shortcuts to speed up summing tasks.

The SUM Function in Excel

AutoSum Shortcut:

Pressing Alt + = automatically inserts the SUM function for the selected range.

Steps:

  1. Select a blank cell where you want the total to appear.
  2. Press Alt + = and Excel will automatically suggest a sum range.
  3. Press Enter to complete the function.

SUM in Excel with Percentage Calculations

Using the Percentage formula in Excel with the SUM function is useful for financial and statistical analysis.

Example:

If you have a total amount in B1 and a percentage in B2, you can calculate the percentage of the total using:

=B1 * B2

To sum multiple percentage-based values:

=SUM(A1:A10) * B1

This formula sums values in A1:A10 and then multiplies by the percentage in B1.

Exporting SUM Function in Excel PDF

After creating calculations, you may need to save or share your Excel file as a PDF.

Steps to Save Excel as PDF:

  1. Click on File > Save As.
  2. Choose the destination folder.
  3. In the “Save as type” dropdown, select PDF.
  4. Click Save.

You can also use Ctrl + P to open the print menu and select “Save as PDF.”

The SUM Function in Excel

Conclusion

The SUM function in Excel is a fundamental tool for data analysis, enabling users to perform quick and efficient calculations. Whether you need to sum a column, apply conditional summation with SUMIF, or use advanced SUM functions, Excel provides powerful methods to handle diverse scenarios. By mastering SUM formulas and shortcuts, users can streamline their workflow and improve productivity in data management.


Needs help with similar assignment?

We are available 24x7 to deliver the best services and assignment ready within 3-4 hours? Order a custom-written, plagiarism-free paper

Get Answer Over WhatsApp Order Paper Now

Advanced Excel Functions for Academic and Professional Success|2025

Master Advanced Excel Functions for Academic and Professional Success. Learn powerful techniques to enhance data analysis, improve efficiency, and achieve better results in both academic assignments and professional projects. In today’s data-driven world, Microsoft Excel remains one of the most powerful tools for analyzing, visualizing, and managing data. Whether you’re a student aiming for academic excellence or a professional seeking to enhance your career, mastering advanced Excel functions is crucial for success. The ability to use advanced Excel formulas with ease can help you unlock insights from your data, optimize workflows, and make better decisions.

In this comprehensive guide, we will explore a range of advanced Excel functions that will equip you for academic and professional success. We will cover essential Excel formulas for data analysis, provide practical examples, and discuss the advanced Excel skills checklist you need to succeed. We will also look at the importance of including advanced Excel skills on your resume and share some insights into what Excel skills employers are looking for.
Why Master Advanced Excel Functions?

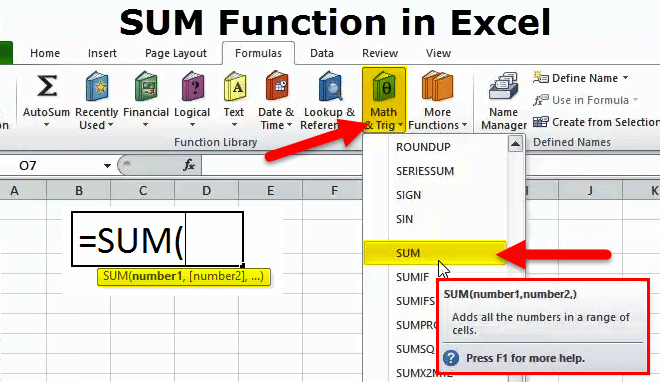
Microsoft Excel is widely used across industries, including finance, engineering, marketing, and education. Excel’s capabilities extend far beyond basic spreadsheet functions such as SUM, AVERAGE, and COUNT. Advanced Excel functions allow you to manipulate large datasets, perform complex calculations, and present your findings in clear, visually appealing ways. Whether you are a student working on a research project or a professional preparing business reports, these advanced functions can significantly improve the quality and efficiency of your work.

In academic environments, advanced Excel formulas for data analysis can help you analyze and present data more effectively, which is crucial for completing assignments and research papers. In the professional realm, mastering advanced Excel skills can enhance your productivity and make you a more valuable asset to your employer. With the rise of big data, automation, and business intelligence, Excel skills have become a key competitive advantage.

Advanced Excel Functions for Academic and Professional Success

Essential Advanced Excel Functions for Data Analysis

Here are some of the most powerful advanced Excel functions that will help you excel both academically and professionally:

VLOOKUP and HLOOKUP

The VLOOKUP (Vertical Lookup) and HLOOKUP (Horizontal Lookup) functions allow you to search for a value in a row or column and return a corresponding value from another row or column. These are extremely useful for cross-referencing data and performing lookups in large datasets.

Example of VLOOKUP:

Imagine you have a dataset with employee names in Column A and their respective salaries in Column B. If you want to find the salary of a specific employee, you can use the following formula:

=VLOOKUP(“John Doe”, A:B, 2, FALSE)

This will search for “John Doe” in column A and return the salary from column B.

INDEX and MATCH

While VLOOKUP and HLOOKUP are commonly used, INDEX and MATCH offer more flexibility. These functions work together to allow you to look up values in a more efficient way, especially when dealing with large datasets.

Example of INDEX and MATCH:

Using the same employee data example, here’s how you would use INDEX and MATCH to look up an employee’s salary:

=INDEX(B:B, MATCH(“John Doe”, A:A, 0))

The MATCH function finds the row number of “John Doe” in column A, and the INDEX function retrieves the corresponding salary from column B.

SUMIF, SUMIFS, COUNTIF, and COUNTIFS

These conditional functions are used to sum or count values based on one or more criteria. They are incredibly useful for filtering data and analyzing subsets of information.

SUMIF: Adds values based on a single condition.
SUMIFS: Adds values based on multiple conditions.
COUNTIF: Counts the number of cells that meet a single condition.
COUNTIFS: Counts the number of cells that meet multiple conditions.
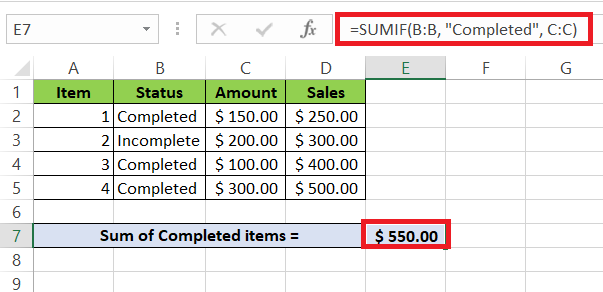
Example of SUMIF:

If you want to calculate the total sales for a specific region, you could use the SUMIF formula:

=SUMIF(A2:A10, “East”, B2:B10)

This formula will sum all the values in B2:B10 where the corresponding value in A2:A10 is “East”.
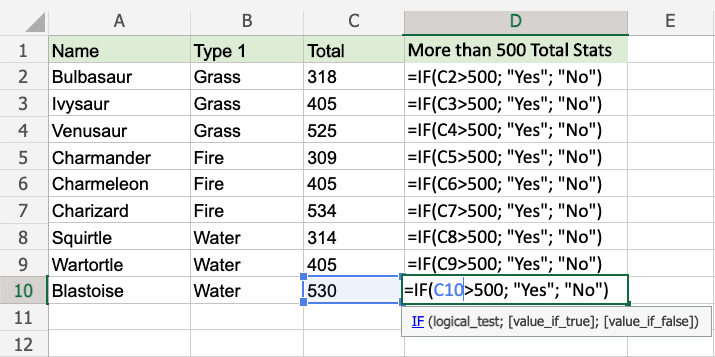
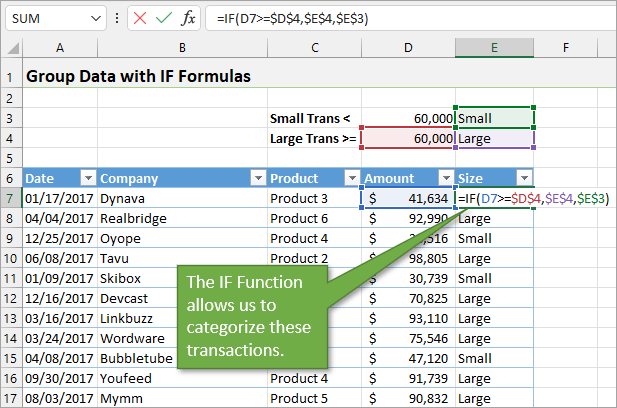
IF, AND, OR

The IF function allows you to perform conditional logic in Excel. You can combine IF with AND or OR to create more complex conditions.

IF: Checks if a condition is true or false, and returns different values based on the result.
AND: Returns TRUE if all conditions are true.
OR: Returns TRUE if any condition is true.

Example of IF, AND, OR:

If you want to check if an employee’s sales are above a target of 100 and the region is “East”, use the following formula:

=IF(AND(A2=”East”, B2>100), “Target Met”, “Target Not Met”)

This will check if both conditions are true and return “Target Met” if both are true, or “Target Not Met” otherwise.

Pivot Tables

Pivot tables are one of the most powerful tools in Excel for summarizing and analyzing large datasets. With pivot tables, you can group, filter, and aggregate data dynamically to uncover insights.

How to Create a Pivot Table:

Select the data range.
Go to the Insert tab and click Pivot Table.
Drag fields to the Rows, Columns, and Values areas to organize your data.

Pivot tables are invaluable when you need to analyze data from multiple angles, such as summarizing sales by region or department.
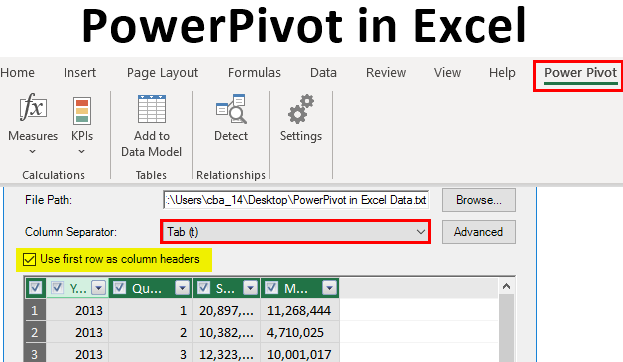
Power Query

Power Query is an advanced tool in Excel that allows you to clean and transform data before you use it in your analysis. It can connect to external data sources, remove duplicates, change data types, and perform other data manipulation tasks.

Power Query is especially useful when dealing with large datasets from different sources that need to be cleaned and structured before analysis.

Advanced Excel Functions for Academic Success

Students working on assignments, research papers, and projects can benefit greatly from mastering advanced Excel functions. Here are some examples of how advanced Excel functions can be applied in academic scenarios:

Analyzing Research Data with Statistical Functions

Advanced Excel offers a variety of statistical functions, such as AVERAGE, MEDIAN, STDEV, CORREL, and FORECAST, that can be used to analyze and interpret research data.

Example: If you have a dataset of test scores and you want to calculate the standard deviation to understand the variation in scores, use the STDEV function:

=STDEV(A2:A10)

This will give you the standard deviation for the test scores in A2:A10.

Using Excel for Financial Modeling and Analysis

Students in business, finance, or economics programs often use Excel for financial modeling. Advanced Excel functions such as NPV (Net Present Value), IRR (Internal Rate of Return), and PMT (Payment) are essential for performing financial analysis.

Example of NPV:

=NPV(0.05, B2:B10) – B1

This formula calculates the NPV of a series of cash flows from B2:B10 with a discount rate of 5%, subtracting the initial investment in B1.
Advanced Excel Skills Checklist for Professional Success

For professionals, mastering advanced Excel functions is essential to increasing productivity and making data-driven decisions. Here’s a checklist of skills that can boost your career:

Data Analysis: Master pivot tables, VLOOKUP, INDEX and MATCH, and other data analysis tools.
Advanced Formulas: Learn to use complex functions such as SUMIFS, COUNTIFS, IF statements, and ARRAY formulas.
Dashboards: Be able to create Excel project management dashboards and other interactive reports.
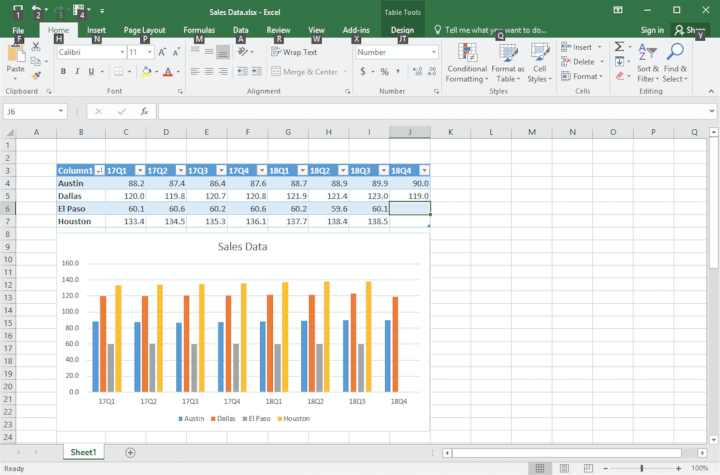
Data Visualization: Learn to create charts, graphs, and dynamic visualizations that highlight key data trends.
Power Query: Know how to clean and transform data with Power Query.
Automation with Macros: Automate repetitive tasks using Excel macros and VBA (Visual Basic for Applications).

By mastering these advanced Excel skills, you’ll be well-equipped for handling complex datasets and reporting needs in your career.
What Excel Skills Are Employers Looking For?

Employers are looking for candidates who are proficient in advanced Excel functions, especially those who can handle large datasets and derive insights for decision-making. Some of the most in-demand Excel skills for employers include:

Data Management and Analysis: The ability to work with large datasets, use pivot tables, VLOOKUP, and INDEX/MATCH for analysis, and automate reporting.
Excel Formulas and Functions: Understanding of advanced formulas like SUMIFS, IF, and COUNTIF to filter and summarize data.
Financial Modeling: Skills in building financial models and performing NPV, IRR, and ROI analysis.
Visualization: Experience in creating dashboards and visualizing data using charts and Power BI.
Automation: Proficiency in automating repetitive tasks using macros and VBA.

Why Choose GETSPSSHELP.COM for Excel Assistance

If you’re struggling to master advanced Excel functions or need personalized support for your academic or professional Excel assignments, GETSPSSHELP.COM is here to help. We provide:

Customized Excel Solutions: Get help with specific functions, formulas, and complex assignments tailored to your needs.
Step-by-Step Tutorials: Learn advanced Excel techniques with Advanced Excel formulas PDF and easy-to-follow guides.
Excel Course Support: Access expert guidance on Advanced Excel courses, including practical applications for academic and professional settings.
Real-Time Assistance: Whether you need help creating a financial model or a project dashboard, our experts are available to provide real-time support.

Visit GetSPSSHelp.com today and take your Excel skills to the next level. Let us help you unlock your academic and professional potential with advanced Excel expertise.

In conclusion, mastering advanced Excel functions is essential for both academic and professional success. With the right skills, you can tackle complex data analysis tasks, create insightful reports, and make better-informed decisions. By leveraging the power of Excel, you’ll not only improve your efficiency but also enhance your career prospects. For personalized support and expert guidance, visit GetSPSSHelp.com—the ultimate destination for mastering Excel

Needs help with similar assignment?

We are available 24x7 to deliver the best services and assignment ready within 3-4 hours? Order a custom-written, plagiarism-free paper

Get Answer Over WhatsApp Order Paper Now

How to Prepare Stunning Excel Presentations for Your Assignment Projects|2025

Learn how to prepare stunning Excel presentations. Discover tips and techniques for creating visually appealing charts, graphs, and data visualizations that effectively communicate your insights and impress your audience. Creating impactful and professional Excel presentations is an essential skill for academic and professional success. Whether you’re delivering a business report, a data analysis project, or a statistical review, Excel’s robust features enable you to visualize and present data effectively. In this guide, we’ll discuss how to prepare stunning Excel presentations for your assignment projects, incorporating essential tips, templates, and tricks that can help you stand out.

We will also focus on the most popular keywords related to Excel presentations, such as How to prepare stunning Excel presentations for your assignment projects free, Excel presentation Examples, MS Excel presentation PDF, Excel presentation PPT, Excel presentation mode, Excel presentation for beginners, Excel presentation topics, and Excel presentation format. This article will help you make the most of Excel’s features to ensure your assignment presentations are both visually appealing and data-driven.

How to Prepare Stunning Excel Presentations

The Power of Excel for Assignment Presentations

Excel is far more than a simple tool for calculating numbers. It is a powerful platform for creating dynamic presentations. The ability to turn complex datasets into clear, understandable visuals can make your assignment presentations much more engaging and persuasive.

Excel can support different kinds of presentations, whether you need to create simple charts to visualize your data or present comprehensive analysis using tables and PivotTables. Additionally, the variety of templates and presentation modes available in Excel means you can customize your presentation style to suit your project and audience.

How to Prepare Stunning Excel Presentations for Your Assignment Projects Free

The first step in preparing an Excel presentation is to determine your objective and the message you wish to convey. Are you showing trends over time? Do you need to highlight a specific set of data points? Knowing the purpose of your presentation will guide your design choices.

Free Excel Templates for Stunning Presentations

One of the best ways to create professional presentations without starting from scratch is by using free Excel presentation templates. These templates come with pre-built layouts for creating impactful charts, graphs, and tables, saving you time and effort. Some of the most popular types of templates include:

  • Business Report Templates: Ideal for showcasing sales trends, financial summaries, or key performance indicators (KPIs).
  • Gantt Chart Templates: Perfect for project timelines or task tracking.
  • Financial Model Templates: For budgeting, forecasting, or analyzing financial data.
  • Sales Dashboard Templates: Displaying sales data visually with charts and tables.

Many free resources are available online, including at trusted websites like getspsshelp.com. These free templates can make a significant difference in the quality of your presentation.

Excel Presentation Examples

When learning how to prepare an Excel presentation, viewing Excel presentation examples can provide valuable inspiration. These examples demonstrate how to structure data and present it visually for maximum impact. Below are a few examples of presentation formats commonly used in academic and professional settings:

  • Data Dashboards: Displaying multiple data points in one view for easy comparison.
  • Trend Analysis Charts: Line or bar charts that track changes over time, useful for analyzing financial data or business performance.
  • Comparison Tables: Comparing different categories or time periods side-by-side.
  • Scatter Plots: Great for showing correlations between two variables.

By analyzing these examples, you can learn how to design your own presentation with attention to clarity, simplicity, and relevance to your topic.

How to Prepare Stunning Excel Presentations

MS Excel Presentation PDF

Once your Excel presentation is ready, you may need to share it with others in a non-editable format. MS Excel presentation PDF files are ideal for this purpose. PDF is a universally recognized format that preserves the layout, fonts, and design of your presentation.

To save your Excel presentation as a PDF:

  1. Click on the File tab.
  2. Select Save As.
  3. Choose PDF from the list of file formats.
  4. Select the desired options (e.g., entire workbook or selected sheets).
  5. Click Save.

This feature allows you to maintain the integrity of your Excel presentation while making it accessible to your audience without the risk of alteration.

Excel Presentation PPT

Another popular way to present your Excel data is by converting it into a PowerPoint (PPT) presentation. Excel integrates seamlessly with PowerPoint, allowing you to copy charts, tables, and graphs directly into your slides. The following steps will guide you in creating an Excel presentation PPT:

  1. Create Your Excel Visuals: Build charts, tables, and graphs in Excel as you normally would.
  2. Copy the Excel Visuals: Highlight the visual or table you want to use, then right-click and select Copy.
  3. Open PowerPoint: Create a new presentation in PowerPoint.
  4. Paste Your Excel Visuals: Right-click in the PowerPoint slide and select Paste Special, then choose the appropriate format (e.g., Excel Chart or Picture).

Using Excel’s features within PowerPoint ensures your data-driven visuals are presented clearly and professionally. This method is great for presenting assignments that require both detailed data and a more formal, structured presentation format.

How to Prepare Stunning Excel Presentations

Excel Presentation Mode

Excel’s presentation mode is a powerful feature when you need to showcase your data during a live presentation. This mode allows you to focus solely on the content of your presentation, hiding unnecessary menus and toolbars for a more immersive experience.

To activate Excel presentation mode, you can use the following techniques:

  • Full-Screen View: Maximize your Excel window and hide the ribbon (by pressing Ctrl + F1). This gives you a clean, uncluttered presentation environment.
  • Hide Gridlines: Gridlines can distract from your data, so turn them off by selecting View > Gridlines and unchecking the option.
  • Zoom Functionality: Use the Zoom function (located in the bottom-right corner) to ensure your visuals are appropriately sized for your audience.

By using Excel’s presentation mode, you can ensure that your focus remains on the message you want to deliver, not on the background settings.

Excel Presentation for Beginners

If you’re new to Excel presentations, it’s important to start with the basics. Here’s a simple approach to creating an Excel presentation for beginners:

  1. Organize Your Data: Begin by cleaning and organizing your data in a way that highlights key points. Use sorting and filtering features to structure your dataset.
  2. Use Basic Charts: Start with simple charts like bar charts, line charts, and pie charts to represent your data visually.
  3. Add Titles and Labels: Ensure each chart is labeled appropriately and has a clear title.
  4. Focus on Simplicity: Avoid overwhelming your audience with too many charts or overly complex visualizations.

Once you’ve mastered the basics, you can begin exploring more advanced features, such as pivot tables, conditional formatting, and data validation, to take your presentations to the next level.

Excel Presentation Topics

When preparing an Excel presentation for your assignment, it’s important to choose relevant Excel presentation topics that align with your subject matter. Popular topics for assignments include:

  • Sales Analysis: Presenting monthly or quarterly sales data and trends.
  • Budget Forecasting: Showing projected vs. actual budget expenses.
  • Customer Segmentation: Analyzing customer data to identify market segments.
  • Project Timelines: Creating Gantt charts to show project milestones.
  • Financial Reports: Presenting financial performance metrics such as profit margins, return on investment, and revenue growth.

These topics are commonly used across various academic disciplines and can be visualized effectively using Excel’s data analysis and presentation tools.

How to Prepare Stunning Excel Presentations

Excel Presentation Format

The Excel presentation format plays a crucial role in making your assignment project look professional and polished. A well-organized presentation format should include:

  • Clear Titles and Headings: Use bold text and larger font sizes for titles.
  • Consistent Font Style and Size: Maintain uniformity in your presentation by using the same font throughout (e.g., Calibri or Arial).
  • Appropriate Color Schemes: Use contrasting colors for text and background to make your presentation readable.
  • Legible Chart Labels: Ensure your charts have clear and concise labels and axis titles.
  • Data Tables: Organize data in tables with alternating row colors to enhance readability.

An organized and aesthetically pleasing format helps to highlight key points and makes it easier for your audience to follow your presentation.

Why Getspsshelp.com is the Best Website for Excel Presentation Assistance

If you’re struggling to create a stunning Excel presentation for your assignment, getspsshelp.com is the best website to get expert assistance. Our team of professionals has extensive experience in creating high-quality Excel presentations that impress and convey the message clearly.

Here’s why you should choose getspsshelp.com:

  • Expert Support: Our specialists are skilled in using Excel for creating professional and visually appealing presentations.
  • Tailored Solutions: We provide personalized guidance to ensure your assignment meets the specific requirements of your project.
  • Free Resources: We offer free templates, tutorials, and tips to help you create stunning Excel presentations without starting from scratch.
  • Fast Delivery: We understand deadlines, and our team works quickly to provide you with the best possible support.

Visit getspsshelp.com today for expert help with preparing stunning Excel presentations that will elevate your assignment projects and help you achieve top grades!


Conclusion

Excel is an incredibly versatile tool that can enhance the quality of your assignment presentations. From free templates and MS Excel presentation PDFs to the use of PowerPoint for Excel presentation PPTs, there are countless ways to make your data shine. By mastering Excel’s presentation mode, format, and charting capabilities, you can create presentations that engage and inform your audience. If you need expert assistance with your Excel presentation, getspsshelp.com is the go-to resource for professional guidance and support.

Needs help with similar assignment?

We are available 24x7 to deliver the best services and assignment ready within 3-4 hours? Order a custom-written, plagiarism-free paper

Get Answer Over WhatsApp Order Paper Now

How to Use Excel for Project Management Assignments: Tips and Tricks|2025

Master How to Use Excel for Project Management Assignments with expert tips. Learn to create Gantt charts, track progress, manage budgets, and organize tasks effectively. Simplify your project planning and boost your assignment performance with Excel’s powerful tools! In today’s world of project management, professionals are increasingly turning to Microsoft Excel for its versatility and user-friendly nature. Excel provides a robust platform for managing tasks, tracking progress, creating schedules, and collaborating on projects. Whether you’re working on a school project or managing a corporate task, Excel can be an incredibly effective tool for managing the details and complexities of any project.

In this comprehensive guide, we will walk you through how to use Excel for project management assignments. You will learn useful tips and tricks, the benefits of using Excel, how to create real-time project tracking systems, and much more. Additionally, we will discuss popular Excel project management templates and Excel formulas for project management to help you streamline your workflow.


How to Use Excel for Project Management Assignments

Why Use Excel for Project Management?

Excel has long been a staple in business, education, and other industries. It is easy to use, highly customizable, and capable of handling complex calculations. When it comes to project management, Excel can help you with the following:

  • Task Tracking: Create project schedules, timelines, and task lists.
  • Budgeting and Cost Management: Monitor and track project expenses and resources.
  • Team Collaboration: Share documents, update statuses, and manage project milestones.
  • Reporting and Analysis: Create dashboards, charts, and reports to visualize project progress.
  • Risk Management: Assess potential risks and keep track of risk management actions.

By using Excel, you can handle a variety of project management tasks without needing specialized software. This makes it ideal for both small and large projects and for people who are just getting started in project management.


Excel for Project Management: Getting Started

To begin using Excel for project management, you need to familiarize yourself with the basic tools and templates. Microsoft Excel comes with several built-in templates, but you can also create your own customized solutions.

Excel Project Management Templates

Templates can save you a significant amount of time and effort. Whether you’re working on a simple project or a large-scale initiative, Excel project management templates help you organize your work efficiently. Some common templates include:

  • Task Lists and Gantt Charts: These templates help you organize project tasks, define milestones, and track progress.
  • Budget Trackers: Use templates to monitor project costs and budget allocations.
  • Project Schedules: Customize templates for timelines, deadlines, and project phases.

Excel for Project Management Course Resources

If you are new to using Excel for project management, enrolling in an Excel for Project Management course can help you master essential skills. These courses typically cover how to use advanced functions like formulas, pivot tables, and charts to manage and track project data. Additionally, courses may include hands-on exercises to practice real-world applications, helping you build confidence and competence with Excel tools.

You can also find many free resources like Excel for project management PDF guides to improve your skills. These resources are useful for learning the foundational tools needed to manage project data effectively.


Essential Excel Tools for Project Management

Once you have the basics down, you can start using specific Excel tools and functions that are tailored to project management needs. Here are some essential Excel tools for project management:

Excel Project Management Dashboard

An Excel Project Management Dashboard is one of the most powerful tools to visualize your project’s overall status. Dashboards display key metrics, such as:

  • Task completion percentages
  • Project milestones
  • Budget vs. actual costs
  • Team member performance

Dashboards give you a quick overview of the project’s health, allowing you to make informed decisions. You can create dashboards using Excel charts, pivot tables, and conditional formatting to highlight important data.

How to Create a Dashboard in Excel:

  • Identify key project metrics (e.g., budget, completion status, timelines).
  • Use Excel charts (pie charts, bar graphs, etc.) to represent each metric visually.
  • Use pivot tables to summarize data and apply filters to show relevant information.
  • Use conditional formatting to color-code key milestones, costs, or statuses.

Creating an interactive dashboard in Excel for project management can save you time and effort by providing clear, actionable insights at a glance.

How to Use Excel for Project Management Assignments

Excel Progress Tracker Template

A progress tracker template helps you keep track of the ongoing tasks in a project. It is essential for monitoring deadlines, understanding which tasks are completed, and tracking what is still pending.

To create a simple progress tracker in Excel, follow these steps:

  • Create columns for Task Name, Start Date, End Date, Assigned To, and Status (e.g., Not Started, In Progress, Completed).
  • Use conditional formatting to change the color of the “Status” column based on task completion (e.g., green for completed, yellow for in progress).
  • Add a progress bar for each task using the REPT function. This will visually show how much of each task has been completed.

Excel Progress Tracker Template can be customized based on your project’s specific needs, whether it’s tracking software development or event planning.

How to Create a Real-Time Tracker in Excel

Managing project progress in real-time can be challenging, but Excel can help by creating a real-time tracker for your project. Here’s how you can set up a basic real-time tracker in Excel:

  • Step 1: Create columns for tasks, deadlines, assigned team members, and their current status.
  • Step 2: Use Excel formulas for project management to automatically update the progress. For example, use the IF function to check if a task’s due date is approaching and highlight the task accordingly.
  • Step 3: Link the tracker to a Gantt Chart or a similar project timeline to see how tasks overlap.
  • Step 4: Update progress manually or use Excel macros to automate real-time updates when changes are made.

By creating a real-time tracker, you can keep everyone informed and on the same page, enabling seamless project management.

Excel Formulas for Project Management

Excel formulas are crucial for automating calculations and improving project management tasks. Some commonly used formulas in project management include:

  • SUMIF and COUNTIF: These functions are useful for adding or counting values that meet specific criteria, such as counting the number of tasks that are completed or adding the total cost for tasks that fall within a certain category.
  • IF Statements: The IF function allows you to create logical tests to track task completion or calculate budgets based on certain conditions (e.g., if the task is completed, set the status to “Completed”).
  • DATEDIF: This function calculates the difference between two dates. It is helpful for tracking the time remaining to complete a task or calculating project milestones.
  • NETWORKDAYS: This function calculates the number of working days between two dates, excluding weekends and holidays. It is useful for project timelines and setting deadlines.

By mastering Excel formulas for project management, you can reduce manual effort and enhance the efficiency of your project.


Project Management Templates and Resources

There are many Project management Excel templates free that you can download and customize for your projects. Some great resources to consider include:

  • Gantt Chart Templates: These templates help you visualize project timelines and task dependencies.
  • Budget Tracking Templates: These templates help monitor project budgets, track expenses, and ensure you stay within financial limits.
  • Task Management Templates: These templates provide a detailed breakdown of tasks, deadlines, and team assignments.
  • Risk Management Templates: These templates allow you to track potential project risks and plan for contingencies.

These templates help streamline the project management process by providing ready-to-use structures that can be customized for any project.


Best Practices for Project Management in Excel

While Excel is a powerful tool for project management, it is essential to follow best practices to ensure efficiency and accuracy. Some best practices include:

  1. Organize Your Data Efficiently: Keep data structured and easy to navigate. Use clear headings and keep related information together.
  2. Use Data Validation: Prevent errors by using data validation rules, such as dropdown menus, to limit the input options for certain cells.
  3. Leverage Conditional Formatting: Make important data points stand out using conditional formatting. This can help highlight overdue tasks, approaching deadlines, or budget issues.
  4. Collaborate Effectively: Use Excel online for real-time collaboration with team members. Ensure everyone has access to the latest version and updates.
  5. Automate Reports with Macros: If you find yourself repeating the same actions, automate your processes with Excel macros to save time and reduce errors.

How to Use Excel for Project Management Assignments

Why Choose GetSPSSHelp.com for Project Management Excel Assistance?

While using Excel for project management can greatly enhance your ability to organize and track project tasks, we understand that mastering Excel’s advanced features and functions can be challenging. That’s why GetSPSSHelp.com is the best resource for assistance.

At getspsshelp.com, we offer:

  • Expert Help with Excel Project Management Templates: We provide customized solutions, including templates, dashboards, and trackers tailored to your project needs.
  • Step-by-Step Guides and Resources: Access Excel for Project Management PDF guides and tutorials to help you learn Excel project management skills quickly.
  • Formula and Dashboard Assistance: Get personalized help with Excel formulas for project management and creating Excel project management dashboards.
  • Real-Time Support: Our team is available to provide real-time support for your project management assignments, helping you navigate complex Excel tasks.

Whether you’re working on an assignment or a professional project, GetSpssHelp.com offers the expertise and resources you need to excel. Let us help you achieve success in your project management endeavors today.


In conclusion, Excel is an indispensable tool for managing projects, whether you are working on an academic assignment or a real-world business task. With the right templates, tools, and formulas, you can streamline your workflow, track progress in real time, and analyze data efficiently. By utilizing Excel’s powerful features, you will be well-equipped to handle complex project management tasks and deliver successful results. For expert support and guidance, visit GETSPSSHELP.COM and take your Excel skills to the next level!

Needs help with similar assignment?

We are available 24x7 to deliver the best services and assignment ready within 3-4 hours? Order a custom-written, plagiarism-free paper

Get Answer Over WhatsApp Order Paper Now

How to Use Excel What-If Analysis to Solve Assignment Problems|2025

Learn how to use Excel What-If Analysis tools to forecast, simulate scenarios, and make data-driven decisions. Master techniques like Goal Seek, Scenario Manager, and Data Tables for better analysis and outcomes. In the world of business and data analysis, one of the most important skills is the ability to predict and assess potential outcomes.

What-If Analysis in Excel is a powerful tool that helps you make informed decisions by simulating different scenarios. Whether you are working on an Excel assignment, a financial forecast, or any other type of data modeling, What-If Analysis can help you explore how changes in certain variables affect your results. In this article, we will explore how to use Excel’s What-If Analysis tools to solve assignment problems, including real-life examples, tips, and detailed insights.


How to Use Excel What-If Analysis

What is What-If Analysis in Excel?

What-If Analysis is a feature in Excel that allows users to explore different possible outcomes based on varying input values. It’s a way to answer questions like:

  • What would happen if I change the price of a product?
  • How will my financial projections change if sales increase by 10%?
  • What would be the impact if I adjust the cost structure in my budget?

With What-If Analysis, you can test various scenarios and see how changes in one or more variables will affect your results. This type of analysis is particularly useful when solving complex problems or making decisions based on uncertain conditions.

Excel provides several tools within What-If Analysis, including Goal Seek, Data Tables, and Scenario Manager. These tools help you create different models to simulate different situations and understand potential outcomes. Let’s dive deeper into each of these tools.


What-If Analysis Goal Seek in Excel

Goal Seek is one of the most widely used tools in Excel’s What-If Analysis suite. It is used when you have a desired result (goal) and need to find the input value that will help you achieve that goal. For example, if you’re working on a financial model and you want to determine the price of a product that will result in a specific profit margin, Goal Seek can help you find that price.

How to Use Goal Seek in Excel:

  1. Set Up Your Model: Start by creating a formula that links the outcome to one or more variables. For example, if you’re calculating profits, your formula might look like this:
    Profit = (Selling Price - Cost Price) * Quantity Sold.
  2. Access Goal Seek: Go to the Data tab on the ribbon and select What-If Analysis. Then choose Goal Seek from the dropdown.
  3. Set the Goal: In the Goal Seek dialog box, input the following:
    • Set cell: The cell that contains the formula you want to optimize (e.g., your profit cell).
    • To value: The desired result (e.g., a target profit).
    • By changing cell: The input variable that you want to adjust to achieve the goal (e.g., the price of the product).
  4. Run the Analysis: Click OK, and Excel will automatically calculate the input value that achieves your desired outcome.

What-If Analysis Goal Seek Example:

Imagine you want to know what selling price will generate a profit of $10,000, given the following:

  • Cost price: $50
  • Quantity sold: 500 units

You would set up the formula Profit = (Selling Price - 50) * 500, and use Goal Seek to find the required selling price that will generate a profit of $10,000.


How to Use Excel What-If Analysis

What-If Analysis Data Table in Excel

A Data Table is another powerful tool in Excel’s What-If Analysis toolkit. It allows you to analyze how changing one or two variables affects the results of a formula. This is useful when you want to perform a sensitivity analysis, such as determining how changes in sales and expenses will impact profitability.

How to Use Data Table in Excel:

  1. Set Up Your Model: Create a formula that depends on one or two variables. For instance, you could have a formula like this for profit: Profit = (Sales Price * Quantity) - (Fixed Costs + Variable Costs).
  2. Create the Data Table: Create a column or row with different values for one variable (e.g., sales price). If you’re using a two-variable data table, create both a row and a column with different values for each variable (e.g., sales price and quantity).
  3. Access the Data Table: Highlight the range where you want the results to appear. Go to the Data tab, click on What-If Analysis, and choose Data Table.
  4. Define Row and Column Inputs: In the Data Table dialog box, input the Row Input Cell (the variable represented by the row) and the Column Input Cell (the variable represented by the column). If you’re using a one-variable data table, only the Column Input Cell is needed.
  5. Run the Data Table: Once you’ve set up your model and defined your inputs, Excel will populate the table with calculated results for each combination of the variables.

What-If Analysis Data Table Example:

Suppose you want to see how different sales prices and quantities affect profit. You could create a data table with different sales prices along the rows (e.g., $10, $15, $20) and different quantities along the columns (e.g., 100, 200, 300). The data table will calculate the profit for each combination of sales price and quantity.


How to Use Excel What-If Analysis

What-If Analysis in Excel Scenario Manager

Scenario Manager is another useful tool for What-If Analysis. It allows you to define and compare different scenarios by changing multiple variables at once. This is helpful when you want to explore different business conditions or model various future possibilities, such as best-case, worst-case, and most likely scenarios.

How to Use Scenario Manager in Excel:

  1. Set Up Your Model: Begin by creating a model with multiple variables. For example, a budget model might include variables like sales volume, unit cost, and marketing expenses.
  2. Define Scenarios: Go to the Data tab, select What-If Analysis, and choose Scenario Manager. In the Scenario Manager dialog box, click Add to create a new scenario. Define the changing cells (the cells that will vary between scenarios) and specify the values for each scenario.
  3. Create Multiple Scenarios: You can create several scenarios, each with different values for the changing cells. For instance, you could create a Best Case scenario with high sales volume and low costs, a Worst Case scenario with low sales and high costs, and a Most Likely scenario with average values.
  4. View the Results: After defining your scenarios, click Show to view the results for each scenario. Excel will update the model with the values for each scenario and allow you to compare the outcomes side-by-side.

What-If Analysis Scenario Manager Example:

Suppose you’re forecasting sales for a product. You could create three scenarios:

  • Best Case: Sales of 1,000 units, unit price of $20, and low marketing expenses.
  • Worst Case: Sales of 500 units, unit price of $15, and high marketing expenses.
  • Most Likely Case: Sales of 750 units, unit price of $18, and average marketing expenses.

Scenario Manager will allow you to compare the results for each scenario.


Where is What-If Analysis in Excel Online?

In Excel Online, the What-If Analysis tools are somewhat limited compared to the desktop version of Excel. However, some features, such as Goal Seek, are available. To access What-If Analysis in Excel Online:

  1. Open your Excel file in the web version of Excel.
  2. Go to the Formulas tab.
  3. Select What-If Analysis from the options provided.

Note that Excel Online does not currently support the full functionality of Data Tables and Scenario Manager, so these features are best used in the desktop version.


How to Use Excel What-If Analysis

Why Choose GetSPSSHelp.com for Excel What-If Analysis Assistance

If you’re struggling with What-If Analysis in Excel or any other advanced Excel topics, GETSPSSHELP.COM is your go-to resource. Our team of experts is highly skilled in Excel functions and can help you navigate the complexities of What-If Analysis with ease.

At GETSPSSHELP.COM, we offer:

  • Step-by-step What-If Analysis Excel examples and tutorials
  • Personalized support for Goal Seek, Data Tables, and Scenario Manager
  • Comprehensive resources like What-If Analysis in Excel PDF for learning
  • Expert guidance on how to solve complex Excel assignment problems using What-If Analysis

Whether you’re working on an academic project or need help with a business analysis task, GETSPSSHELP.COM provides the tools and knowledge to ensure you succeed. Don’t let your assignments overwhelm you—let our experts assist you in mastering What-If Analysis and achieving top marks.


In conclusion, What-If Analysis in Excel is an indispensable tool for anyone looking to solve complex assignment problems or conduct data analysis. By mastering tools like Goal Seek, Data Tables, and Scenario Manager, you can unlock the full potential of Excel to model various scenarios, predict outcomes, and make better decisions. Whether you are a student or a professional, these tools can make a significant difference in your work.

For comprehensive support, expert guidance, and resources on Excel What-If Analysis, visit GETSPSSHELP.COM today and let us help you excel in your assignments!

Needs help with similar assignment?

We are available 24x7 to deliver the best services and assignment ready within 3-4 hours? Order a custom-written, plagiarism-free paper

Get Answer Over WhatsApp Order Paper Now

Tips for Completing Complex Excel Statistical Assignments with Confidence|2025

Discover expert tips for completing complex Excel statistical assignments with confidence. Learn essential techniques for data analysis, formula application, and visualizing results to excel in your assignments. Excel is a powerful tool for statistical analysis, offering numerous features and formulas to tackle complex data-driven assignments. However, navigating its advanced functionalities can be daunting without the right strategies. This guide provides actionable tips and techniques to complete complex Excel statistical assignments with confidence.


Tips for Completing Complex Excel Statistical Assignments with Confidence

Master Basic Excel Skills

Before delving into advanced statistical tasks, ensure a strong foundation in basic Excel skills. These include:

  • Data Entry and Formatting: Accurately input data and apply consistent formatting.
  • Basic Formulas: Familiarity with SUM, AVERAGE, IF, and COUNT functions.
  • Sorting and Filtering: Organize data efficiently for analysis.
  • Cell References: Understand the difference between absolute and relative references.

Resources:

  • Basic Excel Topics List: Review fundamental concepts to build a solid base.

Develop Intermediate Excel Skills

Enhancing your proficiency with intermediate Excel skills prepares you for more complex tasks. These include:

  • Pivot Tables: Summarize and analyze large datasets with ease.
  • Conditional Formatting: Highlight key data patterns.
  • Data Validation: Prevent errors during data entry.
  • Text Functions: Use LEFT, RIGHT, MID, and CONCATENATE for text manipulation.

Tips:

  • Practice regularly using sample datasets.
  • Refer to an Intermediate Excel Skills Checklist to track your progress.

Advanced Excel Skills for Data Analysis

Mastery of advanced Excel skills is crucial for tackling statistical assignments. Key features include:

  • Statistical Functions: Use STDEV, VAR, NORM.DIST, and CONFIDENCE to perform statistical calculations.
  • Solver Tool: Optimize solutions for linear programming and resource allocation.
  • Data Analysis ToolPak: Perform regression, ANOVA, and other statistical tests.
  • Advanced Charting: Create dynamic charts and graphs for data visualization.

Checklist:

  • Review an Advanced Excel Skills Checklist to ensure comprehensive preparation.
  • Download an Advanced Excel Skills for Data Analysis PDF for reference.

Tips for Completing Complex Excel Statistical Assignments with Confidence

Tips for Completing Complex Excel Statistical Assignments with Confidence

Plan Your Approach

  • Understand the Requirements: Clarify assignment objectives and identify the required statistical techniques.
  • Organize Data: Clean and structure your dataset for accurate analysis.
  • Break Down Tasks: Divide the assignment into manageable steps.

Use Templates and Pre-Built Tools

  • Statistical Templates: Utilize pre-designed Excel templates for regression, correlation, and hypothesis testing.
  • Macros: Automate repetitive tasks to save time.

Leverage Advanced Features

  • Data Tables: Analyze multiple scenarios with ease.
  • Power Query: Clean and transform data efficiently.
  • What-If Analysis: Explore different outcomes using Goal Seek and Scenario Manager.

Validate Your Results

  • Cross-Check Calculations: Double-check formulas and outputs.
  • Visualize Data: Use charts to identify anomalies and trends.

How to Describe Excel Skills on Resume

Highlighting your Excel expertise on a resume can make you stand out to employers. Include:

  • Advanced Excel Skills for Data Analysis: Showcase specific tools like Pivot Tables and Solver.
  • Achievements: Quantify your impact, e.g., “Optimized data processing time by 30% using advanced Excel techniques.”
  • Certifications: Mention relevant courses and certifications.

Example:

  • “Proficient in creating dynamic dashboards and performing complex statistical analysis using advanced Excel functions.”

What Excel Skills Are Employers Looking For?

Employers value candidates who can:

  • Analyze Data: Perform robust statistical calculations.
  • Visualize Insights: Create meaningful reports and dashboards.
  • Automate Processes: Use Macros and VBA for efficiency.
  • Solve Problems: Apply tools like Solver for optimization challenges.

Tips for Completing Complex Excel Statistical Assignments with Confidence

Common Challenges and Solutions

Challenge 1: Understanding Complex Formulas

  • Solution: Break down formulas into smaller parts and test components individually.

Challenge 2: Managing Large Datasets

  • Solution: Use Power Query and Pivot Tables for efficient handling.

Challenge 3: Errors in Statistical Functions

  • Solution: Use IFERROR to handle errors gracefully and verify data integrity.

Resources for Learning Advanced Excel

Free Courses and PDFs:

  • Advanced Excel Course Online Free: Explore platforms like Coursera and edX.
  • Advanced Excel Formulas PDF: Download guides for step-by-step instructions.

Practice Tools:

  • Excel Templates: Use ready-made templates for statistical analysis.
  • Online Simulators: Practice Excel skills in a risk-free environment.

Tips for Completing Complex Excel Statistical Assignments with Confidence

Why Choose GetSPSSHelp.com for Excel Assignments?

Expertise:

  • Our team specializes in advanced Excel statistical analysis, ensuring accurate and high-quality results.

Comprehensive Support:

  • Step-by-step guidance for mastering complex Excel functions.
  • Assistance with data cleaning, statistical calculations, and report generation.

Convenience:

  • Affordable services tailored to your academic needs.
  • Quick turnaround times for urgent assignments.

24/7 Availability:

  • Round-the-clock support to address your queries and concerns.

Visit GetSPSSHelp.com today to excel in your assignments with confidence!


Final Thoughts

Completing complex Excel statistical assignments requires a combination of foundational knowledge, advanced skills, and practical strategies. By following these tips and leveraging the resources available, you can tackle any challenge with confidence. For expert assistance, trust GetSPSSHelp.com to guide you every step of the way.


Needs help with similar assignment?

We are available 24x7 to deliver the best services and assignment ready within 3-4 hours? Order a custom-written, plagiarism-free paper

Get Answer Over WhatsApp Order Paper Now

Breaking Down Excel PowerPivot: A Game-Changer for Assignment Success|2025

Breaking Down Excel PowerPivot: Learn how to leverage PowerPivot for advanced data analysis, creating powerful models, and improving your Excel skills for better reporting and decision-making. In the world of data analysis and business intelligence, Microsoft Excel remains one of the most powerful tools. However, as data complexity grows, Excel’s standard functionalities may not always be enough. That’s where PowerPivot comes in. PowerPivot, a feature introduced by Microsoft, has revolutionized how data models are built, analyzed, and visualized within Excel. It is a game-changer, enabling users to work with large datasets and create sophisticated models with ease, making it an essential skill for students and professionals alike.

This guide will explore PowerPivot in-depth, demonstrating how this tool can help you master complex data analysis tasks for your assignments. We will also delve into PowerPivot’s integration with Power BI, its various features, and resources like Power Pivot and Power BI PDF, Microsoft Excel 2013: Building Data Models with PowerPivot PDF, and more. Let’s uncover how PowerPivot can be the key to success in your Excel assignments.


Breaking Down Excel PowerPivot

What is PowerPivot?

PowerPivot is an Excel add-in that provides advanced data modeling capabilities. Unlike traditional Excel features, PowerPivot allows you to work with large datasets from multiple sources, perform powerful calculations, and create sophisticated data models all within Excel. With PowerPivot, you can integrate and analyze data from multiple sources (databases, external files, web data) and easily manage relationships between various datasets.

PowerPivot takes Excel’s capabilities to the next level by enabling you to:

  • Handle large volumes of data efficiently
  • Create relationships between different data tables
  • Perform advanced calculations with DAX (Data Analysis Expressions)
  • Build interactive reports and dashboards
  • Improve data analysis and reporting accuracy

PowerPivot is an essential tool for anyone working with data, especially for tasks such as advanced Excel assignments or business intelligence-related projects.


How PowerPivot Enhances Your Excel Assignments

For students and professionals alike, Excel assignments often require handling large volumes of data and performing complex analysis. PowerPivot significantly simplifies this process, and mastering it can give you a competitive edge when completing data-related tasks. Here’s how PowerPivot can benefit your Excel assignments:

Handling Large Data Volumes

One of the biggest limitations of standard Excel is its handling of large data sets. PowerPivot’s data engine, built on the VertiPaq compression technology, allows users to work with millions of rows of data without slowing down performance. This is ideal for students working on assignments that require the analysis of large datasets or building models with substantial amounts of data.

Simplified Data Integration

PowerPivot allows you to import data from multiple sources and easily integrate them into a single model. You can connect data from SQL Server, Access, Excel, and even web-based sources. By merging data from various sources, you can create a comprehensive model that’s much more accurate and powerful than models built from a single dataset.

Advanced Calculations with DAX

DAX (Data Analysis Expressions) is a formula language used in PowerPivot to create powerful calculated columns and measures. DAX is designed specifically for handling data in PowerPivot and Power BI, enabling users to create custom calculations that go beyond the basic Excel functions. Students can use DAX for more advanced analysis, including time-based calculations, aggregations, and financial models.

Relationships Between Data Tables

One of the most powerful features of PowerPivot is the ability to create relationships between multiple tables. In traditional Excel, you might use VLOOKUP or INDEX MATCH to link different tables. However, PowerPivot allows you to establish relationships between tables using primary and foreign keys, just like in relational databases. This makes it easier to work with complex data models and create more sophisticated analyses.

Efficient Reporting and Visualization

Once your data is modeled in PowerPivot, you can easily generate dynamic reports and dashboards that allow you to present your findings. The integration of PowerPivot with Power BI enables you to create visually appealing reports that are interactive and can be easily updated with new data.


Breaking Down Excel PowerPivot

Getting Started with PowerPivot in Excel

To use PowerPivot in Excel, you need to have Excel 2010 or later. In Excel 2013 and later, PowerPivot comes built-in as an add-in, but you may need to enable it. Here are the steps to get started:

Enabling PowerPivot in Excel

  • For Excel 2013 and later: PowerPivot is already available as an add-in. To enable it, go to File > Options > Add-ins and select COM Add-ins. Then check the box for PowerPivot.
  • For Excel 2010: You need to download and install the PowerPivot add-in from Microsoft’s website.

Importing Data

Once PowerPivot is enabled, you can begin importing data. Click the PowerPivot tab and choose Manage. This opens the PowerPivot window, where you can add data from various sources, such as Excel tables, databases, and external data feeds.

Creating Relationships

To create relationships between tables, you can use the Diagram View in PowerPivot. This view allows you to visually manage relationships, which is especially useful when you have multiple tables that need to be connected.

Using DAX Formulas

To create custom calculations, you’ll need to use DAX. DAX is similar to Excel formulas but optimized for working with large datasets and data models. Common functions in DAX include CALCULATE, SUMX, AVERAGEX, and FILTER.

Creating PivotTables and Reports

Once your data is ready, you can create PivotTables to summarize the data. These PivotTables can be used to perform various analyses and generate reports. With PowerPivot, you can create calculated fields, apply filters, and group your data more effectively than with standard PivotTables.


PowerPivot and Power BI: A Seamless Integration

PowerPivot’s integration with Power BI, Microsoft’s business intelligence platform, further enhances its capabilities. Power BI provides powerful visualization tools and allows you to build dynamic, interactive dashboards. PowerPivot, on the other hand, is ideal for modeling and transforming the data before it’s used in Power BI.

By using PowerPivot and Power BI together, you can:

  • Import large datasets into Power BI from PowerPivot models
  • Create dynamic visualizations and dashboards from PowerPivot data models
  • Share reports and collaborate with others through Power BI’s cloud-based features

For students working on assignments or business professionals building reports, this integration makes it easier to visualize and share findings with others.


Resources for Learning PowerPivot and Power BI

To get the most out of PowerPivot, you should familiarize yourself with various learning materials. Below are some excellent resources that can help you build expertise in PowerPivot and Power BI:

Power Pivot and Power BI PDF

One of the best ways to learn PowerPivot is by downloading Power Pivot and Power BI PDFs. These PDFs provide a comprehensive overview of PowerPivot and its integration with Power BI, making them a great reference for assignments and real-world applications. Look for PDFs that cover advanced topics like creating complex DAX formulas, optimizing data models, and building reports.

Microsoft Excel 2013: Building Data Models with PowerPivot PDF

For users working with older versions of Excel, Microsoft Excel 2013: Building Data Models with PowerPivot PDF is a fantastic resource. It walks you through how to create and manage data models in Excel using PowerPivot, with step-by-step instructions and examples.

Power Query Book PDF Free Download

Power Query is another essential tool that works alongside PowerPivot for data transformation. If you want to learn how to clean and reshape data before importing it into PowerPivot, the Power Query book PDF free download is a must-have. It covers all the features of Power Query, making it easier to work with raw data and prepare it for analysis.

Excel Power Pivot and Power Query for Dummies PDF

For beginners, the Excel Power Pivot and Power Query for Dummies PDF is an excellent resource. This guide breaks down complex concepts into easy-to-understand steps and includes practical examples to help you get started with PowerPivot and Power Query.

Master Your Data with Excel and Power BI PDF Download

To take your skills to the next level, the Master Your Data with Excel and Power BI PDF is a comprehensive guide that focuses on data analysis, visualization, and reporting using both PowerPivot and Power BI. This resource is perfect for students looking to create polished assignments and presentations.


Breaking Down Excel PowerPivot

Why GETSPSSHELP.COM is the Best Website for PowerPivot Help

Mastering PowerPivot and Power BI can be a challenging task, especially when it comes to handling complex data models and advanced calculations. That’s where getspsshelp.com comes in. We offer comprehensive support and resources for students and professionals who need help with PowerPivot and Power BI.

At GetSPSSHelp.com, we provide:

  • Expert PowerPivot tutorials and step-by-step guidance
  • Assistance with building complex data models using PowerPivot and Power BI
  • Help with DAX formulas and data relationships
  • Resources like Power Pivot and Power BI PDF for in-depth learning
  • Assignment help for advanced Excel tasks involving PowerPivot

Our team of experts is here to help you succeed, whether you need help with a specific assignment or you want to build advanced data models for your project. With getspsshelp.com, you’ll have access to the best resources and personalized support to help you master PowerPivot and Power BI.


In conclusion, PowerPivot is a powerful tool that can transform the way you work with data in Excel. By learning PowerPivot and its integration with Power BI, you’ll be equipped to handle complex data analysis tasks with ease. For students looking to succeed in their Excel assignments and professionals aiming to improve their data skills, mastering PowerPivot is a game-changer.

Let getspsshelp.com guide you on your journey to mastering PowerPivot and achieving success in your assignments. With expert support, resources, and tutorials, we make learning PowerPivot easy and efficient. Start today and see the difference it can make in your Excel projects!

Needs help with similar assignment?

We are available 24x7 to deliver the best services and assignment ready within 3-4 hours? Order a custom-written, plagiarism-free paper

Get Answer Over WhatsApp Order Paper Now

How to Handle Missing Data and Errors in Excel for Assignments|2025

Learn how to handle missing data and errors in Excel for assignments with expert tips. Master data cleaning, error correction, and Excel functions to ensure accurate analysis for your academic projects. Perfect your Excel skills and improve your assignment results! How to handle missing data and errors in Excel is a crucial skill for completing assignments effectively. Errors and missing values can distort analyses, misrepresent data trends, and compromise assignment quality. This guide offers actionable tips and advanced techniques to manage missing data and errors in Excel, ensuring the accuracy and professionalism of your work.


How to Handle Missing Data and Errors in Excel for Assignments

Understanding Missing Data and Errors in Excel

What is Missing Data?

Missing data occurs when some entries in your dataset are empty or undefined. Common causes include:

  • Errors during data collection.
  • Incomplete entries in surveys or forms.
  • Data loss during import/export operations.

Types of Errors in Excel

  • #DIV/0!: Division by zero.
  • #VALUE!: Incorrect data type.
  • #REF!: Invalid cell reference.
  • #N/A: Data not available (commonly in lookup functions).

How to Find Missing Values in Excel Using Formula

Excel provides powerful formulas to identify missing data:

  • IF Function: Use =IF(A2="", "Missing", "Complete") to flag empty cells.
  • COUNTIF Function: Identify the total missing values with =COUNTIF(A:A,"").

How to Find Missing Data in Excel

Using Conditional Formatting

  1. Highlight the dataset.
  2. Go to Home > Conditional Formatting > New Rule.
  3. Choose “Format only cells that contain” and set the condition as “Blanks.”
  4. Apply formatting to highlight missing values.

Using Filters

  1. Select the data range.
  2. Click Data > Filter.
  3. Use the dropdown menu to filter blank cells.

How to Handle Missing Data in a Dataset in Excel

Filling Missing Values

  • Replace with Zero: Use =IF(A2="", 0, A2).
  • Replace with Mean: Calculate the mean with =AVERAGE(range) and replace blanks using =IF(A2="", MEAN, A2).
  • Fill Down/Up: Use the Fill option to copy adjacent values.

Removing Missing Values

  • Select the dataset.
  • Go to Data > Filter > Blanks, and delete the rows with missing values.

How to Handle Missing Data and Errors in Excel for Assignments

Excel Missing Data Analysis

Using Data Validation

  • Use Data Validation rules to prevent missing data during entry.

Utilizing Power Query

  1. Load data into Power Query.
  2. Select columns with missing values.
  3. Use “Replace Values” or “Remove Errors” options to handle missing data.

How to Handle Errors in Excel

Identifying Errors

  • Use =IFERROR(formula, "Error") to detect and handle errors in formulas.

Correcting Common Errors

  • #DIV/0!: Replace zero denominators with a logical value.
  • #VALUE!: Ensure correct data type usage.
  • #REF!: Fix broken references by reassigning correct cell ranges.

How to Handle Missing Data and Errors in Excel for Assignments Formula

  • Use VLOOKUP to find missing values: =IF(ISNA(VLOOKUP(value, table, col, FALSE)), "Missing", "Found").
  • Leverage IFERROR for error-free calculations: =IFERROR(A1/B1, 0).

Advanced Techniques for Handling Missing Data

Using VBA for Missing Data

Automate missing data handling with VBA:

Sub FillBlanks()
    Dim rng As Range
    Set rng = Selection
    rng.SpecialCells(xlCellTypeBlanks).Value = 0
End Sub

Using Power BI with Excel

Power BI can enhance Excel’s missing data capabilities:

  • Import Excel data into Power BI.
  • Use advanced imputation techniques to manage missing values.

Practical Examples

Example 1: Handling Missing Data in Sales Reports

  • Use Conditional Formatting to highlight missing entries.
  • Fill missing values with previous month’s data.

Example 2: Managing Errors in Financial Models

  • Employ IFERROR to ensure robust calculations.
  • Validate datasets before running advanced analyses.

How to Handle Missing Data and Errors in Excel for Assignments

Why Choose GetSPSSHelp.com for Excel Assignments?

Unmatched Expertise:

  • Specialists in handling missing data and error corrections.
  • Tailored solutions for academic and professional assignments.

Comprehensive Services:

  • Guidance on using advanced Excel functions and techniques.
  • Exclusive templates, step-by-step guides, and practical examples.

Affordable Rates:

  • Competitive pricing for high-quality services.
  • Discounts for multiple assignments or long-term clients.

24/7 Support:

  • Available around the clock to address your queries.
  • Quick turnaround for urgent assignments.

Final Thoughts

Effectively handling missing data and errors in Excel is crucial for producing reliable assignments. With techniques ranging from simple formulas to advanced automation, Excel offers robust solutions for data management. If you need expert help with your Excel assignments, visit GetSPSSHelp.com today. Let us simplify your data challenges and ensure assignment success!

Needs help with similar assignment?

We are available 24x7 to deliver the best services and assignment ready within 3-4 hours? Order a custom-written, plagiarism-free paper

Get Answer Over WhatsApp Order Paper Now

Advanced Excel Homework Help: How to Build Financial Models with Ease|2025

Looking for Advanced Excel Homework Help? Get expert assistance with complex formulas, data analysis, and spreadsheet tasks. Reliable, affordable, and tailored to meet your academic needs!

Financial modeling is a crucial skill for professionals working in finance, investment banking, corporate development, and other industries that require analysis of financial data. Excel, being one of the most popular tools for financial modeling, plays a key role in making these tasks simpler and more efficient. However, advanced Excel features and formulas can often overwhelm beginners and even intermediate users. If you’re looking for advanced Excel assignment help to build financial models with ease, you’ve come to the right place.

This guide will cover the basics of financial modeling, explore some of the best practices, and delve into advanced Excel techniques and resources that will help you build financial models like a pro. We’ll also take a closer look at how getspsshelp.com can assist you in mastering these complex tasks.


Advanced Excel Homework Help

Understanding Financial Modeling in Excel

Financial modeling refers to the process of creating a mathematical model to represent a company’s financial performance. These models help in forecasting future performance, making investment decisions, and analyzing company financial health.

Excel is the most commonly used tool for financial modeling, primarily due to its versatility, functionality, and user-friendliness. In Excel, financial models are typically built using various types of financial statements like income statements, balance sheets, and cash flow statements. These models are also used to conduct financial analysis, evaluate business decisions, and perform risk assessments.


How to Build Financial Models with Ease in Excel

Building a financial model in Excel is not a one-step process. It requires a systematic approach. Here are the key steps involved:

1. Gather Financial Data

The first step in building any financial model is to gather historical financial data of the company. This includes financial statements, market data, and other relevant information.

2. Create the Structure of the Model

Once the data is gathered, the next step is creating the structure of your financial model. Typically, this involves separating your model into different sections for the income statement, balance sheet, and cash flow statement.

3. Apply Key Assumptions and Drivers

You need to identify key assumptions such as revenue growth rate, cost of goods sold (COGS), operating expenses, and capital expenditures. These assumptions are crucial for building financial projections.

4. Link Financial Statements

Your income statement, balance sheet, and cash flow statement should be linked together. The changes in one financial statement should impact the others. For example, net income from the income statement affects the equity section of the balance sheet.

5. Use Advanced Excel Formulas

Advanced Excel formulas are essential for performing complex calculations in financial modeling. These include IF statements, NPV (Net Present Value), IRR (Internal Rate of Return), and XNPV/XIRR for analyzing cash flows over time. Other advanced functions like INDEX MATCH, VLOOKUP, and OFFSET can also be invaluable for accurate data analysis and modeling.

6. Forecast Future Performance

After inputting the necessary assumptions, you’ll need to forecast the company’s future financial performance. This involves projecting future income, costs, and capital expenditures based on historical trends.

7. Run Sensitivity Analysis

Sensitivity analysis is used to assess how different assumptions (like changes in interest rates, sales growth, or operating costs) will affect the model’s output. This is an important step in assessing risk and planning for various scenarios.

8. Review and Validate the Model

Finally, after building the model, it’s crucial to review it for accuracy and consistency. Cross-checking formulas, verifying assumptions, and ensuring the integrity of your financial data will help you identify any potential errors.


Advanced Excel Homework Help

Best Practices for Financial Modeling in Excel

Building a robust financial model in Excel requires the application of best practices that not only ensure accuracy but also make the model scalable and easy to maintain. Here are the best practices to follow:

1. Clear and Consistent Formatting

A financial model should be easy to read and understand. Use color coding to differentiate between input cells (typically blue) and output cells (usually black). Label all sections and provide detailed comments for clarity.

2. Avoid Hard-Coding Numbers

Instead of entering static numbers into your model, create input cells for assumptions, and reference them throughout the model. This makes the model flexible and easier to update when assumptions change.

3. Build in Layers

Structure your financial model in layers, with each section building upon the previous one. Start with historical data, then move to assumptions, and finally build the forecast.

4. Keep It Simple

Complexity can quickly lead to errors. Keep your formulas simple and avoid unnecessary complexity. It’s better to break down a complex model into smaller, manageable parts.

5. Use Excel Templates

Leverage free financial modeling Excel templates to jump-start your work. These templates can save time and provide you with a strong foundation for your model.

6. Test the Model

Once the model is built, test it under different scenarios to ensure that it behaves as expected. You can run a scenario analysis and a sensitivity analysis to check for robustness.


Advanced Excel Features for Financial Modeling

To make your financial models more effective, it’s important to understand and use advanced Excel features. These tools will streamline your work and ensure accuracy.

Advanced Excel Formulas

  • IF Statements: Used to create logical tests and conditional calculations.
  • NPV and IRR Functions: Key for evaluating the profitability of investment projects and cash flows over time.
  • INDEX MATCH: More flexible and powerful than VLOOKUP, INDEX MATCH allows you to find and return values in a table based on specified criteria.
  • Data Tables: Great for running sensitivity analysis and creating dynamic financial models.

Financial Modeling Templates

There are various Financial Modeling Excel Templates available for free online that can assist you in building accurate and professional financial models quickly. These templates are pre-built models for common financial analyses like budgeting, forecasting, and valuation.

Financial Modeling in Excel PDF

For a detailed, step-by-step guide on financial modeling in Excel, you can download a Financial Modeling Excel PDF. This document will take you through the entire process of building models, with practical examples and Excel screenshots.

Advanced Excel Topics

Some advanced Excel topics that can significantly improve your financial modeling include:

  • Power Query for data import and transformation.
  • Pivot Tables for summarizing large data sets.
  • Solver for optimization problems and finding the best outcomes.
  • VBA (Visual Basic for Applications) for automation and custom solutions.

Advanced Excel Homework Help

Free Resources for Financial Modeling

If you’re looking for free resources to enhance your financial modeling skills, here are some useful links and tools:

  1. Financial Modeling Templates Free: Search online for free financial modeling templates. These can be a lifesaver for quickly building robust models.
  2. Advanced Excel Formulas PDF: Look for downloadable PDFs that break down advanced Excel formulas for financial modeling.
  3. Financial Model Example Excel: Examples of financial models can guide you in building your own models. Free resources often come with downloadable examples.

Why Choose GetSPSSHelp.com for Your Financial Modeling Needs?

While building a financial model in Excel can seem daunting, GetSPSSHelp.com offers the perfect solution to your Excel assignment needs. Whether you’re struggling with advanced formulas or need help creating a professional financial model, GETSPSSHELP.COM provides expert assistance in Excel-based financial modeling.

Our team of professionals is well-versed in the latest financial modeling techniques and Excel functionalities. We can help you with:

  • Understanding complex Excel formulas and functions
  • Building accurate and efficient financial models
  • Offering step-by-step guidance and tutorials
  • Providing financial modeling Excel templates free and Financial Modeling in Excel PDF resources

If you’re looking for Advanced Excel Assignment Help, look no further than GETSPSSHELP.COM. We offer tailored services to help you master financial modeling in Excel with ease. With our help, you’ll be able to complete your assignments on time and with confidence.


In conclusion, mastering financial modeling in Excel requires practice, knowledge of advanced formulas, and the use of best practices. With resources like templates, PDFs, and guidance from experts at GETSPSSHELP.COM, you can build financial models that are not only accurate but also dynamic and scalable.

For all your Advanced Excel Assignment Help, getspsshelp.com is your one-stop solution to learn how to build financial models with ease. Start learning today and make your financial modeling tasks effortless!

Needs help with similar assignment?

We are available 24x7 to deliver the best services and assignment ready within 3-4 hours? Order a custom-written, plagiarism-free paper

Get Answer Over WhatsApp Order Paper Now

How to Create Interactive Reports Using Excel for Your Advanced Assignments|2025

Learn how to create interactive reports using Excel. Discover powerful techniques for building dynamic, data-driven reports with interactive charts, slicers, and pivot tables for better insights and decision-making. Excel is a versatile tool that can transform raw data into compelling, interactive reports. With features such as dashboards, charts, and automation, Excel enables users to present data insights effectively. This guide explores how to create interactive reports in Excel for advanced assignments, offering step-by-step instructions and examples to help you succeed.


How to Create Interactive Reports Using Excel

Understanding Interactive Reports in Excel

Interactive reports are dynamic tools that allow users to manipulate data views without altering the underlying data. They provide:

  • Real-time insights: Updated automatically based on data changes.
  • User engagement: Enable filters, slicers, and buttons for exploration.
  • Professional presentation: Visually appealing and informative layouts.

How to Create a Dashboard in Excel That Updates Automatically

Step-by-Step Process:

  1. Organize Your Data:
    • Use structured tables for consistency.
    • Ensure data is clean, with no empty rows or columns.
  2. Create a Data Model:
    • Import data from multiple sources if needed.
    • Use Power Query to transform and clean data.
  3. Design the Dashboard Layout:
    • Plan sections for charts, KPIs, and filters.
    • Reserve space for user controls (e.g., slicers).
  4. Add Interactive Elements:
    • Use slicers for filtering data.
    • Insert dropdown menus or form controls for dynamic inputs.
  5. Automate Updates:
    • Link charts and tables to your data model.
    • Enable auto-refresh for external data sources.

How to Create a Dashboard in Excel Without Pivot Tables

While Pivot Tables are powerful, dashboards can also be built without them:

  • Use Formulas: Employ SUMIF, COUNTIF, and INDEX-MATCH to summarize data.
  • Dynamic Ranges: Create dynamic named ranges for scalable reports.
  • Conditional Formatting: Highlight key metrics dynamically.

Excel Dashboard Templates Free

Templates simplify the creation process:

  • Downloadable Templates: Access pre-built Excel dashboards for:
    • Sales performance.
    • Financial analysis.
    • Project management.
  • Customization Tips: Modify colors, charts, and formulas to suit your needs.

How to Create Interactive Reports Using Excel

How to Create an Excel Dashboard for Beginners

Easy-to-Follow Steps:

  1. Start Simple: Focus on one data source and key metrics.
  2. Choose the Right Visuals: Use bar charts, pie charts, and line graphs.
  3. Use Built-In Features:
    • Apply slicers to filter data.
    • Use Data Validation for dropdown menus.
  4. Test Your Dashboard: Ensure all elements respond correctly to user inputs.

Create Dashboard in Excel Using Pivot Tables

Pivot Tables offer flexibility for summarizing data:

  1. Insert Pivot Table: Select your data range and choose “Insert Pivot Table.”
  2. Customize Fields: Drag and drop fields into rows, columns, and values.
  3. Create Charts: Convert Pivot Table outputs into dynamic visuals.
  4. Link Slicers: Connect multiple Pivot Tables to slicers for unified control.

Dynamic Dashboard in Excel

Dynamic dashboards respond instantly to data changes. Key techniques include:

  • Using OFFSET and INDIRECT Functions: Create dynamic ranges for charts and tables.
  • Automation with Macros: Write VBA scripts to update dashboards.
  • Interactive Buttons: Add buttons for navigation or resetting filters.

Advanced Tools for Interactive Reporting

Power Query:

  • Clean, combine, and transform data seamlessly.
  • Automate data refresh with minimal effort.

Power Pivot:

  • Manage large datasets using the Data Model.
  • Create relationships between tables for advanced analysis.

Excel Add-Ins:

  • Enhance functionality with add-ins like Solver or Analysis ToolPak.

How to Create Interactive Reports Using Excel

How to Create Dashboard in Excel – YouTube Tutorials

Benefits of Video Learning:

  • Visual demonstrations of complex techniques.
  • Step-by-step guides tailored to specific use cases.

Recommended Channels:

  • “Microsoft Excel Tutorials” for comprehensive lessons.
  • “ExcelIsFun” for detailed walkthroughs.

Why Choose GetSPSSHelp.com for Advanced Excel Assignments?

Expertise You Can Trust:

  • Our professionals excel in creating interactive reports and dashboards.
  • We handle complex requirements with precision and efficiency.

Comprehensive Support:

  • Access personalized guidance for your assignments.
  • Download exclusive templates, tutorials, and PDFs.

Affordable Pricing:

  • Competitive rates for students and professionals.
  • Discounts for bulk assignments or recurring clients.

Proven Track Record:

  • Thousands of satisfied clients across industries and academia.
  • Fast turnaround times to meet tight deadlines.

24/7 Availability:

  • Reach us anytime for assistance with Excel-related challenges.
  • Utilize our live chat, email, or phone support options.

Final Thoughts

Creating interactive reports using Excel is a valuable skill for any advanced assignment. From automated dashboards to dynamic data visuals, the possibilities are endless. If you need expert help, visit GetSPSSHelp.com today. Let us make your Excel assignments seamless and professional!


Needs help with similar assignment?

We are available 24x7 to deliver the best services and assignment ready within 3-4 hours? Order a custom-written, plagiarism-free paper

Get Answer Over WhatsApp Order Paper Now