Balancing Coursework and Data Analysis Projects|2025
/in General Articles /by BesttutorDiscover tips for balancing coursework and data analysis projects. Learn strategies to manage your time, stay organized, and excel in both academic tasks efficiently.
Balancing coursework with data analysis projects can be a significant challenge for students, professionals, and anyone trying to manage multiple responsibilities at once. Data analysis is an essential skill that is increasingly relevant in almost every field today, and its complexity often requires substantial time, effort, and focus. Coursework, on the other hand, provides the foundational knowledge and structure for understanding theoretical concepts in a given field. This paper explores how to structure and manage both academic coursework and data analysis projects effectively, detailing the steps involved in data analysis, the activities that it entails, and the key considerations for presenting a data analysis project.
Introduction
Students, analysts, and researchers often face the challenge of balancing academic coursework with practical data analysis projects. The increasing demand for data-driven insights across industries places great emphasis on the development of analytical skills. In particular, fields such as business, healthcare, social sciences, engineering, and technology rely heavily on data to inform decisions, predict outcomes, and improve processes.
However, while academic coursework imparts valuable theoretical knowledge and domain expertise, data analysis projects require a different skill set. These projects require critical thinking, problem-solving, and the application of various tools and techniques for analyzing, interpreting, and presenting data. Striking a balance between these two demands can be a daunting task, especially when deadlines and expectations for both aspects overlap. Therefore, students and professionals must learn how to effectively structure their time, manage resources, and integrate their academic knowledge with practical applications.
How to Structure a Data Analysis Project
Structuring a data analysis project is crucial for ensuring that the project is organized, efficient, and focused. Whether you are a student working on a term project or a professional dealing with a complex dataset, a clear structure provides a roadmap that guides the project from start to finish.
- Understanding the Problem and Setting Objectives: The first step in structuring a data analysis project is understanding the problem at hand. What are the goals of the analysis? What specific questions are you trying to answer? Clear objectives should be established at the beginning of the project to ensure that the analysis stays focused and aligned with the overall goals.
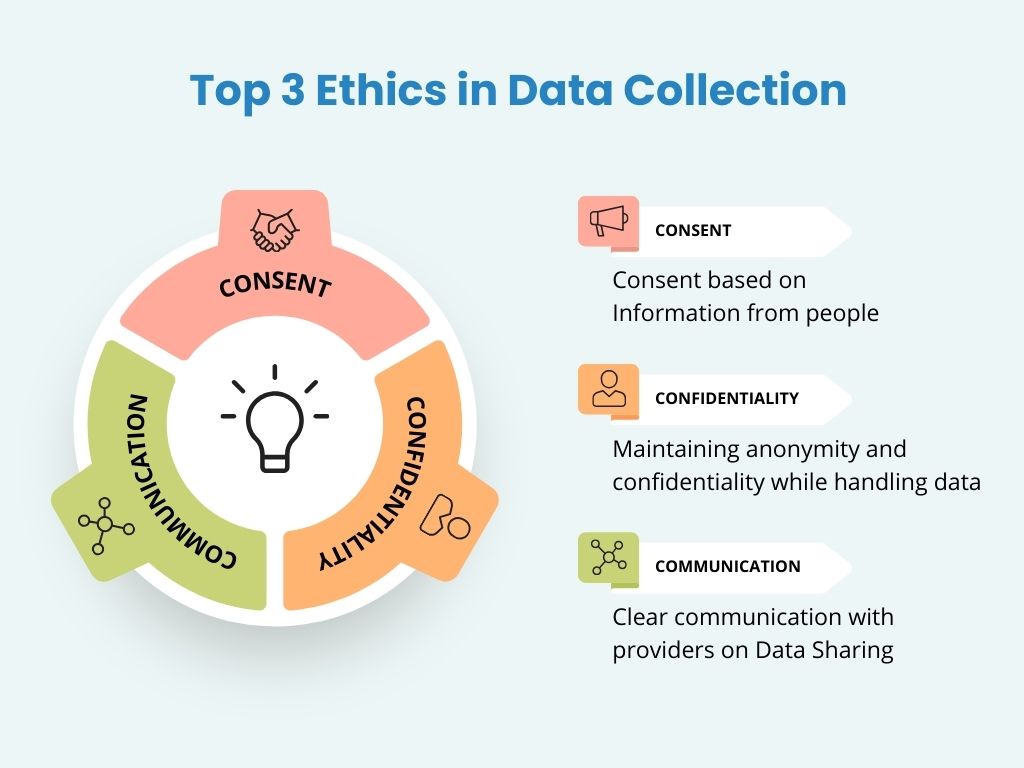
- Data Collection and Acquisition: The next step involves gathering the relevant data for the analysis. This could involve collecting data from various sources such as surveys, experiments, open data repositories, or internal databases. The quality of the data is crucial to the success of the analysis, so data should be carefully selected, ensuring that it is accurate, complete, and relevant to the problem at hand.
- Data Cleaning and Preprocessing: Data often comes with inconsistencies, missing values, or errors that can affect the analysis. Therefore, data cleaning and preprocessing are essential steps in any data analysis project. This step may involve handling missing data, removing outliers, correcting errors, and transforming the data into a format suitable for analysis.
- Exploratory Data Analysis (EDA): Before diving into advanced analysis, it’s important to perform exploratory data analysis. This involves visualizing the data and looking for patterns, trends, correlations, and anomalies. EDA can help you better understand the underlying structure of the data and identify potential areas for further analysis.
- Choosing the Right Analytical Techniques: Depending on the nature of the problem and the data at hand, you will need to select appropriate analytical techniques. For example, you may choose statistical methods such as regression analysis or machine learning techniques like classification or clustering. It is important to choose the right methods based on the objectives of the project and the characteristics of the data.
- Modeling and Analysis: Once the analysis techniques have been chosen, you can proceed to build models or apply algorithms to the data. This phase often involves training models, testing different hypotheses, and evaluating the results based on predefined metrics.
- Interpreting Results: The interpretation phase is crucial in data analysis. The results of the analysis must be evaluated in the context of the original objectives. It’s important to draw conclusions that are meaningful and actionable based on the findings. Interpretation may also involve comparing the results with benchmarks or other studies to validate the findings.
- Presentation and Reporting: The final step is to communicate the results of the analysis. This may involve writing a report, creating visualizations such as graphs or charts, and presenting the findings to stakeholders. A good presentation should not only highlight the key findings but also explain the methodology, assumptions, and limitations of the analysis.

Steps Involved When Working with a Data Analysis Project
Data analysis projects typically involve several distinct stages, each requiring a different set of skills. Below is a detailed outline of the key steps involved in working on a data analysis project:
Problem Definition
Before beginning any data analysis project, it is essential to clearly define the problem. This stage involves understanding the research question or the business problem that the data analysis seeks to address. Defining the problem will help to ensure that the right data is collected, and the appropriate methods are used. A well-defined problem also ensures that the analysis is aligned with the project’s objectives.
Data Collection and Acquisition
Data collection is the next critical step. In this stage, you gather the necessary data from various sources. Depending on the nature of the project, data collection might involve surveys, interviews, extracting data from databases, or scraping data from websites. It’s essential to ensure that the data is relevant, complete, and accurate.
Data Cleaning and Preprocessing
Data cleaning and preprocessing are time-consuming but necessary steps in the data analysis process. The data you collect may have missing values, duplicates, inconsistencies, or errors that need to be addressed. You may also need to normalize or standardize the data to make it suitable for analysis. This step is vital for ensuring that the analysis yields reliable and valid results.
Data Exploration
Exploratory data analysis (EDA) involves examining the dataset in a visual and statistical manner to identify patterns and relationships. Common techniques include plotting histograms, box plots, scatter plots, and calculating summary statistics. This step can also help identify any outliers or anomalies that may require special attention.
Modeling and Analysis
Once the data has been cleaned and explored, the next step is to apply appropriate modeling and analytical techniques. This could involve using statistical methods such as regression analysis or machine learning algorithms like clustering or decision trees. The goal is to extract meaningful insights from the data by applying the most suitable methods.
Evaluation and Validation
After applying models or algorithms, it’s essential to evaluate the results. This can be done by using validation techniques such as cross-validation, testing the model on new data, or comparing it against established benchmarks. The evaluation step helps determine whether the model is performing as expected and if adjustments need to be made.
Interpretation of Results
The interpretation of the results is a critical stage in data analysis. Here, you draw conclusions based on the data and the analysis performed. The interpretation should be linked to the original problem definition and objectives. Any limitations or uncertainties in the analysis should also be addressed.
Communication of Results
Finally, the results of the analysis must be communicated effectively. This involves creating reports, visualizations, and presentations that clearly convey the findings to stakeholders. Effective communication ensures that the insights gained from the analysis can be used to inform decisions or drive action.
Activities Involved in Data Analysis
Several key activities are involved in a data analysis project, and they can vary depending on the scope and complexity of the project. Some of the core activities include:
- Data Collection: Gathering the data from various sources, such as internal databases, external datasets, surveys, and web scraping.
- Data Cleaning: Identifying and addressing issues in the data, such as missing values, inconsistencies, and outliers.
- Data Exploration: Visualizing the data and performing statistical analysis to identify trends, relationships, and potential issues.
- Modeling and Analysis: Applying statistical or machine learning models to analyze the data and extract meaningful insights.
- Validation and Testing: Evaluating the model or analysis results to ensure they are accurate and reliable.
- Result Interpretation: Drawing conclusions from the analysis and ensuring that the results align with the original problem statement.
- Reporting and Presentation: Communicating the findings through reports, charts, and presentations to stakeholders.
How to Present a Data Analysis Project
Presenting a data analysis project effectively is just as important as performing the analysis itself. A well-organized presentation ensures that your audience understands the methodology, results, and significance of your findings. Here are some key considerations for presenting a data analysis project:
Structure Your Presentation Clearly
Begin by structuring your presentation in a clear and logical manner. A typical structure includes:
- Introduction: Introduce the problem, objectives, and the context of the analysis.
- Methodology: Describe the methods and tools used in the analysis, including data collection, preprocessing, and modeling techniques.
- Results: Present the key findings using visualizations (charts, graphs, tables) to make the results easier to understand.
- Conclusion: Summarize the insights gained from the analysis and any recommendations or implications.
Use Visualizations Effectively
Data visualization is a powerful tool for communicating the results of an analysis. Use clear and concise charts, graphs, and tables to illustrate key trends, correlations, and insights. Choose the appropriate type of visualization for the data and the message you want to convey.
Explain Your Methodology
Explain the steps you took during the analysis, including data cleaning, preprocessing, and the modeling techniques used. This helps the audience understand how you arrived at your conclusions and builds confidence in the accuracy and reliability of the results.
Be Clear and Concise
Keep your presentation clear and to the point. Avoid jargon and technical language unless necessary, and focus on delivering the key insights in a way that is easy to understand. Aim for simplicity, especially when presenting to non-technical audiences.
Provide Context
Explain the significance of the findings in the context of the problem. How do the results answer the original question or solve the problem at hand? If applicable, provide recommendations or implications for decision-making based on the analysis.
Be Prepared for Questions
Finally, be ready to answer any questions from your audience. Be prepared to explain your methodology in more detail, address any concerns about data quality or assumptions, and clarify any points that may not be immediately clear.

Conclusion
Balancing coursework with data analysis projects requires careful planning, time management, and organization. Structuring a data analysis project involves defining the problem, collecting and cleaning data, applying appropriate analytical techniques, and presenting the results effectively. Understanding the steps involved in data analysis and the activities associated with it is crucial for success. Moreover, presenting a data analysis project requires clear communication of both the methodology and the insights gained from the analysis. By mastering these skills, students and professionals can successfully balance coursework with practical data analysis, making the most of both academic and practical opportunities.
Needs help with similar assignment?
We are available 24x7 to deliver the best services and assignment ready within 3-4 hours? Order a custom-written, plagiarism-free paper


.webp)