Scholarly Data Analysis Frameworks and Models|2025

Discover the most common scholarly data analysis frameworks and models used in research, from statistical methods to qualitative approaches, and learn how they enhance data interpretation and academic success.

Data analysis is the backbone of research and decision-making in academia and industry. Scholarly frameworks and models help standardize, guide, and optimize the analytical process. These frameworks integrate theoretical constructs with practical tools, ensuring reliable, actionable insights. This article explores the most common scholarly data analysis frameworks and models, delves into examples of data analytics frameworks, and outlines key types of data analysis with practical applications.


 Scholarly Data Analysis Frameworks and Models

Understanding Data Analysis Frameworks and Models

A data analysis framework serves as a structured approach to collect, process, analyze, and interpret data. It combines theoretical models with step-by-step methodologies to ensure systematic data handling. Scholarly frameworks prioritize replicability, reliability, and relevance, often employing both qualitative and quantitative approaches.

Importance of Frameworks:

  • Standardization: Ensures consistency across studies.
  • Decision-making: Facilitates evidence-based insights.
  • Reproducibility: Enables other researchers to validate findings.

Examples of Scholarly Frameworks:

  • CRISP-DM (Cross-Industry Standard Process for Data Mining): Widely used in both academia and industry.
  • KDD (Knowledge Discovery in Databases): A conceptual framework emphasizing iterative exploration.

Data Analytics Framework Examples

A data analytics framework encompasses tools, processes, and methodologies used for extracting insights. Common scholarly frameworks include:

CRISP-DM (Cross-Industry Standard Process for Data Mining)

This framework involves six iterative phases:

  1. Business Understanding: Define goals and objectives.
  2. Data Understanding: Explore and preprocess data.
  3. Data Preparation: Clean, transform, and organize data.
  4. Modeling: Apply statistical or machine learning models.
  5. Evaluation: Assess the model’s performance.
  6. Deployment: Implement results in real-world scenarios.

KDD (Knowledge Discovery in Databases)

This involves discovering useful knowledge in large datasets through these steps:

  1. Selection
  2. Preprocessing
  3. Transformation
  4. Data Mining
  5. Interpretation/Evaluation

DELTA Framework (Data, Enterprise, Leadership, Targets, Analysts)

Focuses on leveraging organizational data strategically, combining technical and managerial perspectives.

Four-Step Data Analytics Framework

This simplified framework emphasizes:

  1. Data collection.
  2. Data processing.
  3. Analysis and interpretation.
  4. Reporting insights.

For additional examples and detailed processes, refer to resources like “Data analytics framework PDF” for downloadable guidelines.


 Scholarly Data Analysis Frameworks and Models

The 4 Types of Analytics with Examples

Data analytics is often categorized into four main types, each addressing specific research or business objectives:

Descriptive Analytics

Focuses on summarizing historical data to identify trends and patterns.

  • Example: Monthly sales reports showing trends in product demand.

Diagnostic Analytics

Explores the root causes of events or outcomes.

  • Example: Analyzing customer churn rates and identifying service-related issues as contributing factors.

Predictive Analytics

Uses statistical models to forecast future outcomes.

  • Example: Predicting student performance based on attendance and past grades.

Prescriptive Analytics

Recommends actions based on predictive insights.

  • Example: Suggesting optimal inventory levels to minimize stockouts.

For practical implementation, combine these analytics types in decision-making processes.


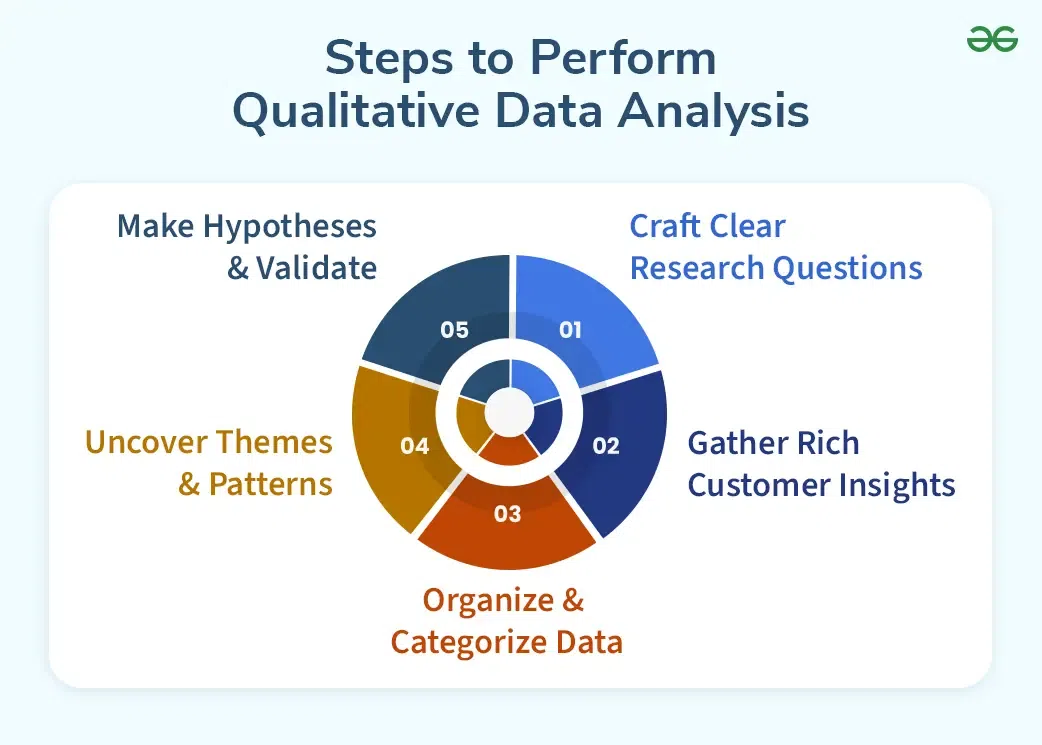
Data Analytics Framework Steps

Implementing a data analytics framework typically follows these steps:

  1. Define Objectives: Understand the problem and formulate goals.
  2. Data Collection: Gather relevant data from reliable sources.
  3. Data Preparation: Clean, transform, and preprocess data for analysis.
  4. Analysis: Apply appropriate statistical, computational, or qualitative methods.
  5. Interpret Results: Contextualize findings and derive meaningful conclusions.
  6. Actionable Insights: Translate results into strategies or recommendations.

These steps ensure a comprehensive approach to analysis, suitable for scholarly and practical applications.


The 5 Types of Data Analytics

Beyond the primary four types, a fifth category is sometimes included to reflect operational analytics. These types collectively enhance decision-making capabilities:

Descriptive Analytics: What happened?

  • Example: Average website traffic over a month.

Diagnostic Analytics: Why did it happen?

  • Example: Evaluating server downtime causes using log data.

Predictive Analytics: What might happen?

  • Example: Weather forecasting using historical patterns.

Prescriptive Analytics: What should we do?

  • Example: Suggesting efficient supply chain routes using AI.

Operational Analytics: How are systems functioning?

  • Example: Real-time monitoring of manufacturing processes.

Types of Data Analytics with Examples

Different types of data analytics cater to various fields:

  • Healthcare: Predicting patient readmissions using predictive analytics.
  • Finance: Fraud detection using diagnostic and predictive analytics.
  • Education: Evaluating teaching methods using descriptive and prescriptive analytics.
  • Retail: Personalized marketing using operational and predictive analytics.

Types of Data Analysis

Data analysis methods vary based on objectives, data types, and research context:

Qualitative Analysis

Focuses on non-numerical data to explore concepts and theories.

  • Example: Thematic analysis of interview transcripts.

Quantitative Analysis

Employs numerical data for statistical or computational evaluation.

  • Example: Regression analysis to predict housing prices.

Mixed Methods Analysis

Combines qualitative and quantitative approaches for a comprehensive understanding.

  • Example: Using surveys and focus groups to evaluate customer satisfaction.

Exploratory Data Analysis (EDA)

Discovers patterns, trends, and anomalies in datasets.

  • Example: Visualizing correlations between variables using scatter plots.

Confirmatory Data Analysis (CDA)

Tests hypotheses using statistical methods.

  • Example: Conducting t-tests to validate experimental results.

 Scholarly Data Analysis Frameworks and Models

Data Analysis and Decision Making

Data analysis is integral to informed decision-making. It involves systematically evaluating data to:

  • Identify problems.
  • Predict outcomes.
  • Formulate strategies.

For detailed steps and examples, refer to “Data analysis and decision making PDF” resources, which provide comprehensive guides for integrating data into strategic frameworks.


Conclusion

Scholarly data analysis frameworks and models provide structured approaches to navigating complex datasets. By understanding types of analytics, their applications, and actionable frameworks, researchers and decision-makers can derive meaningful insights. Whether through CRISP-DM, KDD, or tailored frameworks, the key lies in aligning data strategies with objectives. For deeper insights, explore resources like “Data analytics framework PDF” and practical guides, ensuring a robust analytical foundation for scholarly and practical endeavors.

GetSPSSHelp is the best website for scholarly data analysis frameworks and models because it offers expert statisticians with deep knowledge of academic research and statistical methodologies. The platform specializes in providing customized solutions, ensuring that the chosen framework or model aligns perfectly with your research goals. GetSPSSHelp provides clear guidance and step-by-step support to help students and researchers understand complex data analysis techniques. With a focus on high-quality, accurate results, the website ensures that your analysis is both rigorous and insightful. Additionally, their timely delivery and affordable pricing make GetSPSSHelp a reliable and accessible resource for scholarly data analysis needs.

Needs help with similar assignment?

We are available 24x7 to deliver the best services and assignment ready within 3-4 hours? Order a custom-written, plagiarism-free paper

Get Answer Over WhatsApp Order Paper Now

Challenges SPSS PhD Students Face While Analyzing Data|2025

Explore the common Challenges SPSS PhD Students Face While Analyzing Data, including data management, statistical complexity, and software limitations, and discover strategies to overcome them for successful research outcomes.

SPSS (Statistical Package for the Social Sciences) is a powerful software tool widely used by researchers and students, including PhD candidates, for statistical analysis. Despite its capabilities, many students encounter challenges during their data analysis process. These challenges can stem from a lack of technical expertise, conceptual understanding, and contextual application of SPSS in research. This article explores the most common difficulties PhD students face while analyzing data with SPSS and provides strategies to overcome them.


Challenges SPSS PhD Students Face While Analyzing Data

Limited Understanding of Statistical Concepts

One of the most significant challenges is the lack of foundational knowledge in statistics. SPSS provides a wide range of tools for statistical analysis, but understanding which tests to use and interpreting the results requires a solid grasp of statistical concepts. For instance:

  • Choosing the Right Test: Many students struggle to identify the appropriate statistical tests for their research questions. Misunderstandings about parametric vs. non-parametric tests, assumptions of normality, or the need for sample size calculations can lead to erroneous results.
  • Interpreting Results: SPSS outputs detailed tables, but interpreting these results accurately is often challenging. Misinterpretation of p-values, confidence intervals, or regression coefficients can compromise the validity of research findings.

Solutions:

  • Enroll in advanced statistics courses or workshops to build a strong foundation.
  • Use textbooks or online resources to clarify concepts relevant to your research.
  • Consult with a statistician or supervisor for guidance.

Data Management and Cleaning

PhD students often underestimate the importance of data preparation. Issues related to missing data, duplicate entries, outliers, and inconsistent coding can complicate analysis.

  • Handling Missing Data: Missing values can distort statistical analyses. Students often struggle to decide whether to impute, ignore, or analyze missing data.
  • Data Transformation: Preparing data for analysis often requires merging datasets, creating new variables, or standardizing scales, which can be complex without prior experience.
  • Coding Errors: Mislabeling variables, improper data entry, or inconsistent coding can lead to inaccurate results.

Solutions:

  • Familiarize yourself with SPSS’s data cleaning and transformation tools.
  • Use systematic approaches to document and track changes made during data cleaning.
  • Leverage resources like tutorials, forums, or professional consultations.

Challenges SPSS PhD Students Face While Analyzing Data

Navigating SPSS Interface and Features

SPSS has a user-friendly interface, but its extensive features can overwhelm new users. Many PhD students struggle to locate specific functions or commands, leading to inefficiencies and errors.

  • Syntax vs. GUI: While the graphical user interface (GUI) is intuitive, some advanced analyses require the use of SPSS syntax, which can be intimidating for those unfamiliar with programming.
  • Customization and Add-ons: Knowing how to customize settings or integrate SPSS with other tools (e.g., R or Python) is another common hurdle.

Solutions:

  • Start with SPSS tutorials to learn basic and advanced features.
  • Practice using SPSS syntax for repeatable and efficient workflows.
  • Explore add-ons and integrations gradually, focusing on tools relevant to your study.

Difficulty in Hypothesis Testing

Hypothesis testing is a core aspect of statistical research, yet many students find it challenging to correctly formulate and test hypotheses using SPSS.

  • Null vs. Alternative Hypotheses: Students often struggle to frame hypotheses that align with their research objectives.
  • Errors in Testing: Failing to check assumptions like normality, homogeneity of variance, or linearity can invalidate test results.

Solutions:

  • Clearly define research objectives and hypotheses before beginning analysis.
  • Use pre-analysis checks in SPSS to test assumptions.
  • Consult academic advisors or statistical consultants for feedback on your hypothesis-testing approach.

Challenges SPSS PhD Students Face While Analyzing Data

Dealing with Complex Statistical Models

Advanced analyses, such as structural equation modeling (SEM), hierarchical linear modeling (HLM), or multivariate analysis of variance (MANOVA), can be particularly daunting for PhD students.

  • Model Specification: Identifying the correct variables and their relationships requires advanced knowledge.
  • Model Fit and Diagnostics: Evaluating goodness-of-fit indices or diagnosing model errors can be complex without sufficient expertise.

Solutions:

  • Break down complex models into simpler components and analyze step by step.
  • Use resources like tutorials, workshops, or statistical textbooks specific to your method.
  • Seek expert guidance when dealing with advanced modeling.

Time Constraints

PhD students often face tight deadlines for data analysis as part of their dissertation work. Learning SPSS, cleaning data, and performing analyses under time pressure can lead to errors and frustration.

Solutions:

  • Create a detailed timeline for data analysis and allocate extra time for unexpected challenges.
  • Focus on mastering essential SPSS skills early in the research process.
  • Outsource complex tasks to experts if necessary, ensuring ethical collaboration.

Challenges SPSS PhD Students Face While Analyzing Data

Balancing Software Use and Research Context

A common mistake is over-relying on SPSS to produce results without critically analyzing their relevance or implications within the research context. SPSS is a tool, not a substitute for critical thinking.

Solutions:

  • Continuously relate statistical findings back to your research questions.
  • Discuss findings with peers, mentors, or domain experts to ensure meaningful interpretation.

Limited Access to Resources and Support

Some PhD students lack access to institutional support, SPSS licenses, or expert guidance, especially in resource-constrained settings.

Solutions:

  • Explore free or discounted SPSS licenses offered through universities.
  • Join online forums and communities for peer support.
  • Leverage open-access resources, such as tutorials and webinars.

Challenges SPSS PhD Students Face While Analyzing Data

Fear of Making Mistakes

The fear of errors can paralyze some students, causing them to delay or avoid critical analysis tasks. This is often compounded by a lack of confidence in using SPSS or interpreting results.

Solutions:

  • Practice regularly to build confidence in using SPSS.
  • Use small datasets to test and refine analysis techniques before applying them to larger datasets.
  • Seek feedback from advisors or peers to validate your work.

Communicating Results Effectively

Analyzing data is only part of the research process; presenting findings clearly and concisely is equally important. Many students struggle to:

  • Create Meaningful Visuals: Charts, graphs, and tables generated in SPSS may need customization to effectively communicate results.
  • Write Interpretations: Translating statistical results into coherent narratives can be challenging, especially for non-technical audiences.

Solutions:

  • Use SPSS features to create and customize visuals for clarity.
  • Study examples of well-written statistical interpretations in academic journals.
  • Attend workshops or seek mentorship on academic writing.

Challenges SPSS PhD Students Face While Analyzing Data

Conclusion

PhD students face a variety of challenges while analyzing data with SPSS, from technical difficulties to conceptual misunderstandings. Overcoming these challenges requires a combination of education, practice, and support. By proactively addressing these issues, students can harness the full potential of SPSS to produce high-quality, impactful research. Institutions and educators should also play an active role in equipping students with the skills and resources needed to navigate these challenges effectively.

GetSPSSHelp is the best website for addressing the challenges SPSS PhD students face while analyzing data because it offers expert statisticians skilled in handling complex data analysis issues. The platform provides tailored solutions, ensuring each student’s unique research challenges are met with precision. GetSPSSHelp simplifies intricate statistical methods, guiding students through data interpretation and analysis with ease. With a focus on timely delivery and high-quality results, it helps students overcome time constraints and achieve academic success. Additionally, the platform offers reliable support, ensuring confidentiality and offering affordable services to help students navigate SPSS challenges efficiently.

Needs help with similar assignment?

We are available 24x7 to deliver the best services and assignment ready within 3-4 hours? Order a custom-written, plagiarism-free paper

Get Answer Over WhatsApp Order Paper Now

Understanding Statistical Concepts|2025

Understanding Statistical Concepts is essential for mastering data analysis. Explore key statistical principles, techniques, and their real-world applications to enhance your research and analytical skills. Statistics plays an essential role in understanding, interpreting, and making decisions based on data. It serves as the foundation for research, data science, and numerous fields of study where evidence-based conclusions are vital. This paper delves into the fundamental aspects of statistics, offering insights into basic concepts, their applications, and their importance in various domains.

Understanding Statistical Concepts

Definition of Statistics

Statistics has been defined by various authors, reflecting its diverse applications and significance:

  1. Sir Ronald A. Fisher described statistics as “the science of measurement and inference.”
  2. Croxton and Cowden defined it as “the science which deals with the collection, classification, analysis, and interpretation of numerical data.”
  3. Murray Spiegel referred to statistics as “a branch of mathematics that deals with the organization, analysis, and interpretation of data.”

Each of these definitions underscores the multifaceted nature of statistics, highlighting its role in making sense of data to derive meaningful insights.

Basic Concepts of Statistics

Population and Sample

A population refers to the entire group of individuals or observations under study. A sample, on the other hand, is a subset of the population, selected to make inferences about the population. For instance, in medical research, the population could be all patients with a specific condition, while a sample might consist of patients participating in a clinical trial.

Variables

Variables are characteristics or properties that can take different values. They can be classified into:

  • Qualitative Variables: Non-numeric, such as gender or eye color.
  • Quantitative Variables: Numeric, such as age or income. These can further be divided into discrete and continuous variables.

Descriptive and Inferential Statistics

  • Descriptive Statistics: Concerned with summarizing and describing the features of a dataset using measures such as mean, median, mode, and standard deviation.
  • Inferential Statistics: Focuses on making predictions or inferences about a population based on sample data, using techniques such as hypothesis testing and confidence intervals.

Measures of Central Tendency

  • Mean: The average of a dataset.
  • Median: The middle value when data are arranged in order.
  • Mode: The most frequently occurring value in a dataset.

Measures of Dispersion

  • Range: The difference between the highest and lowest values.
  • Variance: Measures the spread of data points around the mean.
  • Standard Deviation: The square root of variance, indicating the average distance of data points from the mean.

Probability

Probability is a measure of the likelihood of an event occurring. It forms the basis of inferential statistics and is essential in predicting outcomes and making decisions under uncertainty.

Correlation and Regression

  • Correlation: Measures the strength and direction of the relationship between two variables.
  • Regression: A statistical method for modeling the relationship between a dependent variable and one or more independent variables.

Hypothesis Testing

A method used to determine if there is enough evidence to reject a null hypothesis in favor of an alternative hypothesis. Common tests include t-tests, chi-square tests, and ANOVA.

Statistical Significance

Statistical significance indicates whether an observed effect is likely due to chance or reflects a true relationship. A commonly used threshold is a p-value of 0.05.

Understanding Statistical Concepts in Research

Statistical concepts are indispensable in research as they ensure the validity and reliability of findings. Here are key applications of statistics in research:

Data Collection

Statistical techniques guide researchers in designing surveys, experiments, and observational studies to ensure accurate data collection. Sampling methods, such as random sampling and stratified sampling, are employed to represent the population adequately.

Understanding Statistical Concepts

Data Analysis

Descriptive and inferential statistics are used to analyze data. For example:

  • Descriptive statistics summarize the data to identify trends and patterns.
  • Inferential statistics generalize findings from a sample to a broader population.

Testing Hypotheses

Researchers use statistical tests to determine whether their hypotheses are supported by data. For instance, a clinical trial might test whether a new drug is more effective than an existing one using a t-test or ANOVA.

Drawing Conclusions

Statistics help researchers interpret results and assess their implications. Confidence intervals provide a range within which a parameter is likely to lie, while p-values indicate the strength of evidence against the null hypothesis.

Statistical Concepts Examples

Real-Life Example of Descriptive Statistics

A company analyzing customer satisfaction survey results might calculate:

  • Mean satisfaction score to gauge overall sentiment.
  • Median age of respondents to understand the demographic profile.
  • Mode of preferred product features to identify popular choices.

Real-Life Example of Inferential Statistics

A healthcare study examining the effect of a new treatment might:

  • Use a sample of patients to estimate the treatment’s effectiveness for the entire population.
  • Perform a t-test to compare outcomes between treatment and control groups.

Regression in Action

An e-commerce business predicting future sales based on advertising expenditure uses regression analysis to model the relationship between these variables and make data-driven decisions.

Probability Applications

Insurance companies use probability to assess risks and calculate premiums. For instance, the probability of accidents is used to determine car insurance rates.

Basic Statistics Concepts for Data Science

Data science relies heavily on statistical concepts to process and analyze large datasets. Key concepts include:

Data Cleaning and Preprocessing

Before analysis, data must be cleaned to remove errors, handle missing values, and standardize formats.

Exploratory Data Analysis (EDA)

EDA involves summarizing data using descriptive statistics and visualizations to uncover patterns and insights.

Modeling and Machine Learning

Statistical methods, such as linear regression, logistic regression, and clustering, are foundational to machine learning algorithms.

Understanding Statistical Concepts

Performance Metrics

Statistics provide metrics like accuracy, precision, recall, and F1 score to evaluate model performance.

Learning Resources

Basic Concepts of Statistics PDF

PDFs on statistical concepts are valuable for self-study, offering structured content on topics like probability, hypothesis testing, and regression.

Basic Concepts of Statistics Notes PDF

Notes in PDF format provide concise explanations, formulas, and examples, serving as quick references for students and professionals.

Basic Concepts of Statistics PPT

Presentations (PPTs) are effective for visual learners, providing graphical representations of statistical concepts and applications.

Understanding Statistical Concepts

Conclusion

Understanding statistical concepts is essential for interpreting data, conducting research, and making informed decisions. From basic measures like mean and standard deviation to advanced techniques like regression and hypothesis testing, statistics provides the tools necessary to analyze data effectively. Resources such as PDFs, notes, and PPTs further aid in mastering these concepts, empowering individuals in research, data science, and beyond.

GetSPSSHelp is the best website for understanding statistical concepts because it provides expert-led guidance tailored to students at all levels of proficiency. The platform breaks down complex ideas into simple, clear explanations, making it easy to grasp even the most challenging topics. With personalized support and step-by-step tutorials, GetSPSSHelp ensures students gain a solid foundation in statistics while applying concepts effectively to their assignments. The website’s affordable services make high-quality learning accessible, and its 24/7 customer support ensures help is always available when needed. For anyone looking to deepen their knowledge of statistical concepts, GetSPSSHelp is a reliable and comprehensive resource.

Needs help with similar assignment?

We are available 24x7 to deliver the best services and assignment ready within 3-4 hours? Order a custom-written, plagiarism-free paper

Get Answer Over WhatsApp Order Paper Now