Insights into Top 5 Characteristics of Experimental Research Design|2025

Gain insights into top 5 characteristics of experimental research design. Learn key features that make this design essential for controlled and reliable research outcomes.

Experimental research design is a cornerstone of scientific inquiry, providing researchers with the ability to establish causal relationships, control variables, and test hypotheses. Its systematic approach and robust methodology make it a preferred choice across disciplines such as psychology, education, and medicine. This paper explores the top five characteristics of experimental research design, delving into their applications and importance. For ease of accessibility and learning, this discussion incorporates references to PDFs, PowerPoint (PPT) resources, and practical insights.


Characteristics of Experimental Research Design

Manipulation of Independent Variables

One defining characteristic of experimental research design is the deliberate manipulation of independent variables to observe their effects on dependent variables. This manipulation allows researchers to establish causal relationships with precision.

Key Insights:

  • Control and Causation: By manipulating the independent variable, researchers can test cause-and-effect relationships. For instance, in a psychology experiment studying the effect of sleep on memory retention, the amount of sleep (independent variable) can be manipulated to observe its impact on memory test scores (dependent variable).
  • Hypothesis Testing: Manipulation supports the testing of clear hypotheses. True experimental designs, often detailed in PDFs and educational resources, emphasize hypothesis-driven manipulation for robust findings.

Application in Psychology and Education:

  • In psychology, manipulation is often used to explore behavioral responses. For example, varying the type of stimulus to measure reaction time.
  • In education, experiments may manipulate teaching strategies to evaluate their effect on student performance.

Control of Extraneous Variables

The control of extraneous variables is essential to ensure that only the independent variable affects the dependent variable. This characteristic strengthens the validity and reliability of the results.

Key Insights:

  • Randomization: Random assignment of participants to control and experimental groups minimizes the impact of confounding variables. This technique is a hallmark of true experimental research designs and is often emphasized in educational PDFs and PPTs.
  • Use of Control Groups: Including a control group provides a baseline for comparison, isolating the effects of the independent variable.
  • Eliminating Bias: Techniques such as double-blind procedures are commonly employed in psychological experiments to reduce researcher and participant biases.

Application in Education and Psychology:

  • In education, controlling for variables such as prior knowledge or socioeconomic status ensures fair comparisons across teaching methods.
  • In psychological studies, controlling for factors like age, gender, or cultural background ensures that results are generalizable.

Characteristics of Experimental Research Design

Randomization

Randomization is a critical element of experimental research design. It ensures that participants are assigned to groups without bias, thereby enhancing the internal validity of the study.

Key Insights:

  • Fair Distribution: Randomization balances out known and unknown confounding variables across groups.
  • True Experiments: True experimental research design PDFs often highlight randomization as a non-negotiable feature.
  • Statistical Rigor: Randomization supports the use of statistical tests to analyze data objectively.

Examples in Practice:

  • In psychology, randomizing participants to treatment or placebo groups ensures that individual differences do not skew results.
  • In educational research, randomization might involve assigning students to different instructional methods to assess their effectiveness.

Replication

Replication refers to the ability to repeat an experiment and achieve consistent results. This characteristic ensures the reliability and generalizability of findings.

Key Insights:

  • Reproducibility: Experiments must be detailed enough for other researchers to replicate them. Characteristics of good experiments, as discussed in PPTs and PDFs, include clarity in methodology and documentation.
  • Generalization: Replication across diverse settings and populations strengthens the applicability of results.

Examples:

  • Psychological research often replicates experiments to confirm theories, such as the replication of Milgram’s obedience study in different cultural contexts.
  • Educational experiments might replicate studies on teaching strategies across schools with varied demographics to ensure widespread applicability.

Characteristics of Experimental Research Design

Measurement and Observation

Accurate measurement and observation are central to experimental research design. Reliable instruments and standardized procedures ensure that data collected is valid and meaningful.

Key Insights:

  • Operational Definitions: Clear definitions of variables ensure consistent measurement. For example, defining “academic performance” as “average test scores over a semester.”
  • Standardized Tools: Use of validated instruments, such as psychological scales or educational assessments, enhances the reliability of observations.
  • Quantitative and Qualitative Data: Experimental designs may incorporate both data types, although quantitative data is more common.

Application:

  • In psychology, measurements often include physiological data (e.g., heart rate) or survey responses.
  • In education, observations may focus on test scores, classroom behavior, or engagement levels.

Characteristics of Experimental Research Design

Conclusion

The top five characteristics of experimental research design—manipulation of independent variables, control of extraneous variables, randomization, replication, and measurement—are integral to its success and reliability. These characteristics provide researchers with the tools to explore and establish causal relationships, ensuring that findings are both valid and generalizable. Whether through educational PDFs, psychology PPTs, or practical applications, understanding these traits equips researchers to design robust experiments. By adhering to these principles, experimental research continues to contribute significantly to scientific advancement across disciplines.

Needs help with similar assignment?

We are available 24x7 to deliver the best services and assignment ready within 3-4 hours? Order a custom-written, plagiarism-free paper

Get Answer Over WhatsApp Order Paper Now

The Ultimate Guide to Graph Correlation: Positive/Negative and Dissertation|2025

Explore the ultimate guide to graph correlation. Learn how to visualize relationships between variables, interpret results, and enhance your data analysis skills effectively.

Understanding the relationship between two variables is a cornerstone of data analysis, and correlation analysis is one of the most widely used statistical tools to achieve this. Correlation measures the strength and direction of a linear relationship between two variables. Graphical representations of correlation, such as scatter plots and correlation graphs, provide intuitive insights into these relationships. This guide delves into the concepts of positive and negative correlation, discusses the correlation coefficient, explores examples, and introduces the five types of correlation.


What Is Correlation?

Correlation quantifies the degree to which two variables move together. When one variable changes, the correlation indicates whether the other variable tends to change in the same direction (positive correlation), in the opposite direction (negative correlation), or if there is no discernible relationship (zero correlation).

Correlation is typically represented mathematically by the correlation coefficient, denoted as r. The value of r ranges from -1 to +1, with:

  • r = 1: Perfect positive correlation
  • r = -1: Perfect negative correlation
  • r = 0: No correlation

Positive Correlation

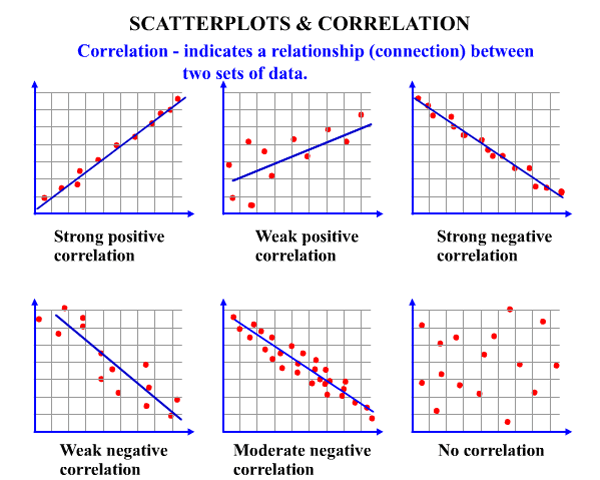
Positive correlation occurs when two variables increase or decrease together. For example, the more hours a student studies, the higher their exam scores tend to be. This relationship can be visualized using a positive correlation scatter plot where data points form an upward-sloping pattern.

Positive Correlation Graph Example:

Consider a scenario where you analyze the relationship between the number of hours spent exercising and calories burned. Plotting this data on a scatter plot reveals an upward trend—indicating a positive correlation.

Characteristics:

  1. Direction: The graph slopes upward from left to right.
  2. Strength: Determined by the proximity of data points to the best-fit line. The closer the points are to the line, the stronger the positive correlation.
  3. Examples:
    • The relationship between years of education and income levels.
    • The connection between marketing budget and sales revenue.

The Ultimate Guide to Graph Correlation

Negative Correlation

Negative correlation occurs when one variable increases while the other decreases. For instance, as the speed of a car increases, the time taken to reach a destination decreases. This inverse relationship can be illustrated using a negative correlation scatter plot, where data points form a downward-sloping pattern.

Negative Correlation Graph Example:

Suppose you analyze the relationship between daily coffee consumption and hours of sleep. A scatter plot might show a downward trend, signifying a negative correlation.

Characteristics:

  1. Direction: The graph slopes downward from left to right.
  2. Strength: Similar to positive correlation, the strength is gauged by the closeness of data points to the line of best fit.
  3. Examples:
    • The relationship between temperature and heating costs.
    • The connection between screen time and sleep quality.

Correlation Coefficient: Strong or Weak?

The correlation coefficient (r) is a numerical measure that indicates the strength and direction of a linear relationship between two variables. The interpretation of r values is as follows:

Strength:

  • Strong Correlation:
    • |r| > 0.7
    • Example: A strong positive correlation (≈ 0.85) between physical activity and cardiovascular health.
    • Example: A strong negative correlation (≈ -0.75) between age and flexibility.
  • Moderate Correlation:
    • 0.4 ≤ |r| ≤ 0.7
    • Example: A moderate positive correlation (≈ 0.5) between study time and test performance.
    • Example: A moderate negative correlation (≈ -0.6) between smoking frequency and lung capacity.
  • Weak Correlation:
    • |r| < 0.4
    • Example: A weak positive correlation (≈ 0.2) between daily water intake and skin elasticity.
    • Example: A weak negative correlation (≈ -0.3) between screen brightness and battery life.

Direction:

  • Positive (r > 0): Variables move in the same direction.
  • Negative (r < 0): Variables move in opposite directions.
  • Zero (r = 0): No linear relationship exists.

The Ultimate Guide to Graph Correlation

Scatter Diagram Correlation Examples

Scatter diagrams are visual tools that depict the relationship between two variables. Each point represents a pair of values from the dataset.

Example 1: Positive Correlation

Imagine a dataset tracking the hours spent practicing an instrument and the resulting proficiency scores. A scatter diagram reveals an upward-sloping pattern, affirming a positive correlation.

Example 2: Negative Correlation

Consider data on car mileage and fuel efficiency. A scatter plot might display a downward-sloping pattern, indicating that higher mileage correlates with lower fuel efficiency.

Example 3: No Correlation

If we plot shoe size against intelligence quotient (IQ), the scatter diagram would likely show no discernible pattern, indicating zero correlation.


What Are the 5 Types of Correlation?

  1. Positive Correlation:
    • Variables increase together.
    • Example: The relationship between height and weight.
  2. Negative Correlation:
    • One variable increases while the other decreases.
    • Example: The relationship between elevation and temperature.
  3. Zero Correlation:
    • No relationship exists between variables.
    • Example: The relationship between hair color and academic performance.
  4. Linear Correlation:
    • Data points form a straight-line pattern.
    • Example: The relationship between distance and time at a constant speed.
  5. Non-Linear (Curvilinear) Correlation:
    • Data points form a curved pattern.
    • Example: The relationship between stress levels and performance, which follows an inverted U-shape (Yerkes-Dodson Law).

The Ultimate Guide to Graph Correlation

Practical Applications of Correlation

Academic Research

Correlation analysis is indispensable in dissertation writing, where researchers often explore relationships between variables to support hypotheses. For instance, a study on the impact of social media usage on mental health might reveal a negative correlation.

Business Insights

Businesses use correlation to identify trends and make data-driven decisions. For example, analyzing the correlation between advertising spend and customer acquisition rates can optimize marketing strategies.

Healthcare

In healthcare, correlation helps identify risk factors for diseases. For instance, researchers might explore the correlation between smoking and lung cancer incidence.


Conclusion

Understanding correlation is crucial for analyzing and interpreting data effectively. Positive and negative correlations, the correlation coefficient, scatter plots, and the five types of correlation form the foundation of this concept. Whether you’re a student, researcher, or business analyst, mastering these principles will enhance your ability to draw meaningful insights from data. By combining graphical tools and numerical measures, correlation analysis provides a comprehensive view of relationships, empowering informed decision-making across various domains.

Needs help with similar assignment?

We are available 24x7 to deliver the best services and assignment ready within 3-4 hours? Order a custom-written, plagiarism-free paper

Get Answer Over WhatsApp Order Paper Now

The Effect of In Store Promotion on Sales Revenue|2025

Explore The Effect of In Store Promotion on Sales Revenue. Learn how strategic discounts, offers, and displays influence consumer purchasing decisions and drive business growth.

In-store promotion is a powerful marketing strategy that plays a critical role in driving sales revenue for businesses. By leveraging promotional tools such as discounts, product displays, samples, and loyalty programs, retailers aim to attract customers, increase purchase frequency, and enhance the shopping experience. In today’s competitive retail landscape, understanding the impact of in-store promotions on sales revenue is vital for creating effective strategies that maximize profitability. This paper delves into the various facets of in-store promotion and its influence on sales revenue, incorporating insights into consumer behavior, promotional techniques, and measurable outcomes.

The Effect of In Store Promotion on Sales Revenue

Understanding In-Store Promotion

Definition and Purpose

In-store promotion encompasses a range of marketing activities conducted within a retail environment to boost product visibility, attract foot traffic, and incentivize purchases. Unlike traditional advertising, which targets a broad audience, in-store promotions focus on engaging shoppers who are already inside the store and are more likely to make a purchase. The primary goals include:

  1. Increasing Sales Revenue: Encouraging customers to buy more products or choose premium items.
  2. Boosting Brand Awareness: Highlighting specific products or brands to enhance their visibility.
  3. Improving Customer Experience: Creating a memorable and enjoyable shopping experience.
  4. Encouraging Impulse Purchases: Stimulating unplanned purchases through attractive deals and displays.

Key Types of In-Store Promotions

Discounts and Price Promotions

Discounts are among the most common in-store promotional techniques. By offering price reductions, businesses can appeal to cost-conscious shoppers, encourage bulk purchases, and clear out inventory. Examples include “buy one, get one free” (BOGO) deals, percentage discounts, and clearance sales. Studies show that discounts can significantly increase sales revenue by reducing perceived cost barriers and creating a sense of urgency.

Product Sampling

Sampling allows customers to try products before purchasing. This is particularly effective for new or unfamiliar products, as it reduces the perceived risk of buying. For example, offering free samples of a new snack can entice customers to purchase it, driving both trial and repeat sales.

Point-of-Sale (POS) Displays

Strategically placed displays at checkout counters or high-traffic areas can capture customers’ attention and encourage last-minute purchases. Eye-catching visuals, creative arrangements, and clear messaging contribute to the effectiveness of POS displays.

Loyalty Programs

Loyalty programs reward repeat customers with points, discounts, or exclusive offers. By fostering long-term relationships, these programs not only drive immediate sales but also increase customer lifetime value.

Seasonal Promotions

Seasonal promotions capitalize on holidays, events, or specific times of the year. For instance, back-to-school sales or holiday-themed discounts align with consumer demand, boosting sales during peak shopping periods.

Consumer Behavior and In-Store Promotion

Impulse Buying

In-store promotions often trigger impulse buying, a phenomenon where consumers make unplanned purchases due to emotional or psychological triggers. Factors such as attractive displays, limited-time offers, and the fear of missing out (FOMO) contribute to this behavior. According to a study by Nielsen, over 60% of shoppers make impulse purchases influenced by promotional tactics.

Perceived Value

Promotions enhance the perceived value of products, making them appear more affordable or desirable. For instance, bundling complementary items or offering discounts on premium products can encourage customers to perceive a higher value for their money, leading to increased sales revenue.

Brand Loyalty

While in-store promotions are often associated with attracting new customers, they can also reinforce brand loyalty. Exclusive offers for existing customers, such as members-only discounts, make shoppers feel valued, encouraging repeat visits and purchases.

Measuring the Impact of In-Store Promotion on Sales Revenue

To evaluate the effectiveness of in-store promotions, businesses must track key performance indicators (KPIs) that reflect their impact on sales revenue. Common metrics include:

  1. Sales Uplift: Comparing sales before, during, and after the promotion to assess incremental revenue.
  2. Foot Traffic: Monitoring the number of customers entering the store during promotional periods.
  3. Conversion Rate: Analyzing the percentage of visitors who make a purchase.
  4. Average Transaction Value (ATV): Calculating the average amount spent per customer.
  5. Customer Retention Rate: Measuring the percentage of repeat customers following a promotion.

Case Studies on In-Store Promotion Success

Grocery Stores and Sampling

A leading grocery chain implemented a sampling program for a new line of organic snacks. The program resulted in a 40% increase in product sales during the promotional period. Furthermore, over 25% of customers who tried the samples became repeat buyers within three months.

Electronics Retailers and Discounts

An electronics retailer launched a “Black Friday” promotion offering steep discounts on popular items. The campaign led to a 150% surge in sales revenue compared to the previous month, demonstrating the effectiveness of targeted price promotions.

Fashion Retail and Loyalty Programs

A fashion brand introduced a loyalty program where customers earned points for every dollar spent. Members of the program accounted for 60% of total sales revenue within a year, highlighting the importance of fostering customer loyalty.

The Effect of In Store Promotion on Sales Revenue

Challenges in In-Store Promotion

While in-store promotions can significantly boost sales revenue, they also present challenges:

  1. Cost Management: High promotional costs, including advertising, staffing, and inventory adjustments, can reduce profit margins.
  2. Over-reliance on Discounts: Frequent price reductions may erode brand value and train customers to expect constant deals.
  3. Inventory Issues: Poor planning can lead to stockouts or excess inventory, negatively impacting customer satisfaction and profitability.
  4. Measuring ROI: Accurately assessing the return on investment (ROI) for in-store promotions requires robust data collection and analysis tools.

Strategies for Effective In-Store Promotion

  1. Targeted Promotions: Tailoring promotions to specific customer segments ensures relevance and maximizes impact. For example, offering student discounts or senior citizen deals aligns with targeted demographics.
  2. Personalization: Leveraging customer data to create personalized offers can increase engagement and conversion rates. Personalized coupons, based on past purchases, resonate more with shoppers.
  3. Omnichannel Integration: Combining in-store promotions with digital marketing efforts, such as social media campaigns or mobile apps, extends their reach and effectiveness.
  4. Employee Training: Educating staff about promotional campaigns enables them to assist customers effectively, enhancing the overall shopping experience.
  5. Innovative Displays: Investing in creative and interactive displays captures attention and encourages customers to explore products.

The Effect of In Store Promotion on Sales Revenue

Future Trends in In-Store Promotion

As technology evolves, so do in-store promotional strategies. Key trends shaping the future include:

  1. AI and Data Analytics: Retailers are increasingly using artificial intelligence and data analytics to predict customer preferences and optimize promotional efforts.
  2. Augmented Reality (AR): AR-enabled displays and mobile apps allow customers to visualize products in real-world settings, enhancing their shopping experience.
  3. Sustainability Initiatives: Eco-friendly promotions, such as discounts for reusable bags or sustainable products, align with growing consumer demand for environmentally responsible practices.
  4. Mobile Integration: Mobile apps and push notifications deliver real-time promotional updates, driving foot traffic and engagement.
  5. Experiential Marketing: Creating immersive in-store experiences, such as live demonstrations or workshops, fosters deeper connections with customers.

Conclusion

In-store promotion is a cornerstone of retail strategy, with a profound impact on sales revenue. By understanding consumer behavior, leveraging diverse promotional techniques, and measuring outcomes effectively, businesses can craft compelling campaigns that drive both short-term sales and long-term growth. However, success requires balancing promotional costs, maintaining brand value, and staying attuned to evolving trends. As the retail landscape continues to change, embracing innovation and personalization will be key to maximizing the effectiveness of in-store promotions.

Needs help with similar assignment?

We are available 24x7 to deliver the best services and assignment ready within 3-4 hours? Order a custom-written, plagiarism-free paper
Get Answer Over WhatsApp Order Paper Now

Ways to Stick to the Dissertation Track|2025

Discover effective ways to stick to the dissertation track with SPSS help. Learn how SPSS can streamline your data analysis, ensure accuracy, and keep your research on course for success.

Writing a dissertation is a monumental task that requires focus, discipline, and effective tools to ensure success. One of the key challenges faced by many students is navigating the statistical analysis required to support their research. This is where SPSS (Statistical Package for the Social Sciences) becomes an invaluable resource. This paper explores the ways to stick to the dissertation track with SPSS help, emphasizing key strategies and tools available, including guides like “SPSS for Research Methods: A Basic Guide PDF,” cheat sheets, and techniques for interpreting and reporting SPSS results.


Why Use SPSS for Data Analysis?

SPSS is one of the most widely used statistical software packages in academia, especially for social science research. Its user-friendly interface, robust functionality, and ability to handle large datasets make it an ideal choice for dissertation work. Key reasons to use SPSS for data analysis include:

  1. Ease of Use: Unlike other statistical software, SPSS features a graphical user interface (GUI) that allows users to perform complex analyses without requiring advanced programming knowledge.
  2. Comprehensive Functionality: SPSS supports a wide range of statistical tests, including descriptive statistics, t-tests, regression analysis, and ANOVA, among others.
  3. Integration with Research Tools: SPSS integrates seamlessly with tools commonly used for research, such as Excel and survey software, making it easier to manage and analyze data.
  4. Trusted Results: SPSS’s reliability and accuracy ensure confidence in the results, which is crucial for defending your dissertation.

By understanding why SPSS is a preferred choice, students can more effectively align their research goals with the capabilities of the software.


SPSS for Research Methods: A Basic Guide PDF

For beginners and advanced users alike, resources like “SPSS for Research Methods: A Basic Guide PDF” serve as essential tools for learning the software. These guides typically provide step-by-step instructions for conducting various statistical tests, importing data, and interpreting results. Some key topics covered in such guides include:

  • Setting Up Your Data: How to format and input data into SPSS.
  • Descriptive Statistics: Generating measures like mean, median, and standard deviation.
  • Hypothesis Testing: Performing t-tests, chi-square tests, and ANOVA.
  • Regression Analysis: Exploring relationships between variables.
  • Exporting Results: How to save and share SPSS output for reports.

Using a comprehensive guide not only helps you learn the basics but also ensures you avoid common pitfalls, keeping your dissertation progress on track.


How to Use SPSS for Survey Data Analysis

Survey data analysis is a common requirement for dissertations, particularly in social sciences, education, and business research. SPSS offers a variety of tools for analyzing survey data, including:

  1. Data Cleaning: Identify and handle missing values, outliers, and errors in your dataset.
  2. Descriptive Analysis: Summarize survey results using frequencies, percentages, and graphical representations.
  3. Cross-Tabulation: Compare responses across different demographic groups.
  4. Factor Analysis: Identify underlying patterns or constructs within survey items.
  5. Reliability Analysis: Assess the consistency of survey instruments using Cronbach’s alpha.

Mastering these techniques ensures that your survey data is analyzed effectively, providing robust evidence for your dissertation.


Ways to Stick to the Dissertation Track

Descriptive Statistics in SPSS with Interpretation

Descriptive statistics are the foundation of any quantitative research. They help summarize and understand the main features of a dataset. In SPSS, you can generate descriptive statistics by following these steps:

  1. Input Data: Enter your data into the SPSS Data View.
  2. Navigate to Analyze > Descriptive Statistics: Select the variables you wish to analyze.
  3. Choose Outputs: Opt for measures like mean, median, mode, range, and standard deviation.
  4. Interpret Results: Understand the central tendency and variability within your data.

For example, if the mean age of respondents in your survey is 35 with a standard deviation of 5, this indicates that most participants are around 35 years old, with a variability of 5 years. Accurate interpretation of these results strengthens your research findings and supports your arguments.


How to Report SPSS Results

Properly reporting SPSS results is crucial for ensuring clarity and credibility in your dissertation. Follow these tips to effectively present your findings:

  1. Use APA Format: Most academic institutions require results to be reported in APA style. Include tables and figures where appropriate, and provide a narrative explanation of the findings.
  2. Be Concise: Highlight key results without overloading the reader with excessive detail. For instance, report significant p-values and confidence intervals rather than raw output.
  3. Visualize Data: Use SPSS’s graphing tools to create charts and plots that illustrate trends and relationships.
  4. Include Interpretation: Clearly explain what the results mean in the context of your research question.

For example:

“A paired t-test was conducted to compare pre-test and post-test scores. The results revealed a significant increase in scores from pre-test (M = 70, SD = 5) to post-test (M = 80, SD = 4), t(29) = 3.5, p < .01.”

By adhering to these guidelines, you ensure your results are both professional and accessible.


SPSS Questions and Answers

As you progress with your dissertation, you may encounter challenges or uncertainties regarding SPSS. Participating in SPSS-focused forums and Q&A platforms can provide valuable assistance. Common questions include:

  • How do I handle missing data in SPSS? Use techniques like mean imputation or multiple imputation to address missing values.
  • Which test should I use for my data? The choice of test depends on your research question and the type of data you have (e.g., t-tests for comparing means, chi-square for categorical data).
  • Can SPSS analyze non-parametric data? Yes, SPSS offers non-parametric tests like the Mann-Whitney U test and Kruskal-Wallis test.

Engaging with the SPSS community allows you to learn from others’ experiences, enhancing your own analytical skills.


SPSS Cheat Sheet PDF

An SPSS cheat sheet is a quick reference tool that summarizes common commands, tests, and procedures. For students working on their dissertations, having this resource at hand can save time and reduce frustration. Key components of an SPSS cheat sheet include:

  • Shortcuts for Importing Data: Quick steps to upload data from Excel or CSV files.
  • Basic Commands: Instructions for generating frequencies, crosstabs, and charts.
  • Statistical Tests: A guide to selecting and running t-tests, ANOVA, regression, etc.
  • Interpretation Tips: Key points to remember when analyzing SPSS output.

Downloading and using an SPSS cheat sheet PDF ensures you stay organized and efficient while working on your dissertation.


Ways to Stick to the Dissertation Track with SPSS Help

Using SPSS effectively can keep you on track throughout your dissertation journey. Here are some practical tips:

  1. Set Clear Milestones: Break down your dissertation into manageable stages, such as data collection, analysis, and writing. Use SPSS to complete each stage efficiently.
  2. Learn Through Tutorials: Access online tutorials, videos, and resources like “SPSS for Research Methods: A Basic Guide PDF” to enhance your understanding of the software.
  3. Practice Regularly: Familiarize yourself with SPSS by practicing with sample datasets before analyzing your actual research data.
  4. Seek Support: Don’t hesitate to ask for help from peers, mentors, or SPSS experts if you encounter difficulties.
  5. Utilize Available Tools: Make the most of resources like SPSS cheat sheets and Q&A forums to solve problems quickly.
  6. Focus on Interpretation: Spend time understanding your results and linking them back to your research questions and hypotheses.

By incorporating these strategies, you can overcome obstacles and maintain steady progress on your dissertation.


Ways to Stick to the Dissertation Track

Conclusion

Sticking to the dissertation track requires careful planning, consistent effort, and the right tools. SPSS serves as a powerful ally in this journey, offering the functionality and support needed to analyze data and present findings effectively. By leveraging resources like “SPSS for Research Methods: A Basic Guide PDF,” cheat sheets, and Q&A platforms, students can master SPSS and confidently navigate the complexities of dissertation research. Whether it’s conducting descriptive statistics, analyzing survey data, or reporting results, SPSS ensures that you stay on course and achieve academic success.

Needs help with similar assignment?

We are available 24x7 to deliver the best services and assignment ready within 3-4 hours? Order a custom-written, plagiarism-free paper

Get Answer Over WhatsApp Order Paper Now

How to Mention a Reference List for Assignments|2025

Learn how to mention a reference list for assignments correctly. Explore proper citation styles, formatting tips, and guidelines to ensure your references are accurate and compliant with academic standards.

When working on academic assignments, referencing is a vital part of the writing process. Proper referencing ensures that the sources of information you use are acknowledged, helping to uphold academic integrity while demonstrating your research skills. This paper provides a comprehensive guide on how to mention a reference list for assignments, including examples and formats such as APA. Additionally, we will address how to include website references and provide tips for creating a sample reference list.

How to Mention a Reference List for Assignments

Why Is Referencing Important?

Referencing serves multiple purposes, including:

  • Acknowledging Sources: It gives credit to authors and researchers whose work has contributed to your understanding of a subject.
  • Avoiding Plagiarism: Proper referencing prevents accusations of plagiarism by clearly distinguishing your ideas from those of others.
  • Enhancing Credibility: A well-referenced assignment demonstrates thorough research and strengthens your arguments.

General Guidelines for Creating a Reference List

A reference list should appear at the end of your assignment and include all the sources cited within the text. Each entry should follow the specific referencing style required by your instructor, such as APA, MLA, Chicago, or Harvard. Below, we will focus on how to mention a reference list for assignments using the APA format.

Components of a Reference List

A complete reference includes the following components:

  1. Author(s): List the author(s) or organization responsible for the work.
  2. Publication Date: Provide the year of publication in parentheses.
  3. Title: Include the title of the work in italics or regular font, depending on the type of source.
  4. Source Information: This may include the name of the journal, book publisher, URL, or DOI.

How to Mention a Reference List for Assignments: APA Format

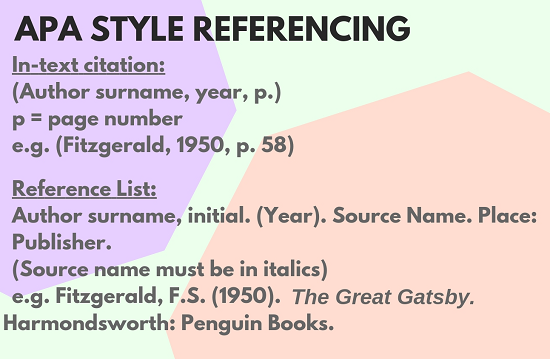
APA (American Psychological Association) style is one of the most commonly used formats for referencing in social sciences and other disciplines. Here is how to mention a reference list for assignments in APA format:

General Format for APA References

  1. Books:
    • Format: Author, A. A. (Year). Title of the book. Publisher.
    • Example: Smith, J. (2020). Introduction to Psychology. Academic Press.
  2. Journal Articles:
  3. Websites:

How to Mention a Reference List for Assignments

How to Write a Website Reference in Assignment Example

Referencing websites can sometimes be tricky, as not all websites provide complete information. Below is a step-by-step example:

Example in APA:

  • Author: Environmental Protection Agency
  • Date: 2022, November 10
  • Title: Reducing air pollution
  • Website: www.epa.gov
  • Reference: Environmental Protection Agency. (2022, November 10). Reducing air pollution. Environmental Protection Agency. https://www.epa.gov/reducing-air-pollution

Sample Reference List in APA Format

Here is a sample reference list for an assignment:

Reference List:

  1. Anderson, P. (2019). Global economics in the 21st century. Penguin Publishers.
  2. Carter, M. J., & Davis, L. P. (2020). Mental health and urban life. Psychology Today, 36(4), 456-478. https://doi.org/10.5678/psyctoday.2020.364
  3. Smith, T. (2021, September 5). Innovations in renewable energy. Scientific American. https://www.scientificamerican.com/innovations-renewable-energy
  4. World Health Organization. (2023). Annual health report. World Health Organization. https://www.who.int/annual-health-report

How to Write Website Reference in Assignment Example PDF

Creating a PDF guide on referencing is an excellent way to ensure you have quick access to the formatting rules. Below is an example of how to structure such a PDF:

Title: How to Write Website References for Assignments: APA Format

Contents:

  1. Introduction: Importance of referencing websites.
  2. General APA Format: Breakdown of the format.
  3. Examples:
    • Government Websites
    • Educational Institutions
    • Blogs and Informal Sites
  4. Common Mistakes to Avoid.

Example PDF Entry:

  • Author: National Aeronautics and Space Administration
  • Date: 2021, July 14
  • Title: Exploring Mars: A new frontier
  • Website: www.nasa.gov
  • Reference: National Aeronautics and Space Administration. (2021, July 14). Exploring Mars: A new frontier. NASA. https://www.nasa.gov/exploring-mars

How to Mention a Reference List for Assignments

How to Mention a Reference List for Assignments Example

The structure of your reference list depends on the types of sources you are citing. Here are some additional examples:

  1. Book with Multiple Authors:
    • Example: Jones, A., Smith, B., & Taylor, C. (2018). Advances in quantum physics. Cambridge University Press.
  2. Edited Book:
    • Example: Brown, L. (Ed.). (2020). Essays on modern art. Oxford University Press.
  3. Conference Paper:
    • Example: Patel, R. (2021). Data analytics in modern healthcare. In Proceedings of the International Data Science Conference (pp. 34-45). Springer.

Tips for Creating a Reference List

Organize Alphabetically

Arrange references alphabetically by the last name of the first author.

Use a Consistent Format

Ensure that all entries in your reference list adhere to the same formatting style.

Double-Check for Accuracy

Verify that all details, such as author names, publication dates, and URLs, are accurate.

How to Mention a Reference List for Assignments

Use Reference Management Tools

Software like Zotero, Mendeley, or EndNote can help you manage citations and generate reference lists automatically.

Include a “References” Heading

Clearly label the section as “References” to distinguish it from the main body of your assignment.

How to Mention a Reference List for Assignments Sample

Below is a sample reference list for a hypothetical assignment on renewable energy:

References:

  1. Green, P. (2018). Solar power: The energy of tomorrow. Renewable Energy Press.
  2. Harris, L. (2022, January 10). The impact of wind turbines on wildlife. Environmental Studies Journal, 54(1), 78-89. https://doi.org/10.2345/envstud.2022.5401
  3. Johnson, R. (2020, March 5). Hydropower: A sustainable solution. Nature Energy. https://www.nature.com/articles/hydropower-solution

Common Mistakes to Avoid

  1. Incorrect Author Names: Always spell author names correctly and in the correct order.
  2. Missing Information: Double-check for missing publication dates, titles, or URLs.
  3. Mixing Styles: Do not mix referencing styles within one assignment.
  4. Improper Formatting: Follow the exact rules of the chosen style, especially for capitalization and punctuation.

By following these guidelines, students can confidently create accurate and well-organized reference lists for their assignments.

Needs help with similar assignment?

We are available 24x7 to deliver the best services and assignment ready within 3-4 hours? Order a custom-written, plagiarism-free paper

Get Answer Over WhatsApp Order Paper Now

Noteworthy Steps to Write a Systematic Literature Review|2025

Discover noteworthy steps to write a systematic literature review. Learn how to organize, evaluate, and present research effectively for academic and professional success.

Systematic literature reviews (SLRs) are critical for synthesizing existing knowledge in a structured and replicable manner. They help researchers identify gaps in the literature, establish evidence for decision-making, and provide a foundation for further study. This paper outlines the noteworthy steps to write a systematic literature review and offers examples, methodological guidance, and resources such as systematic literature review sample PDFs to assist researchers in various fields, including medical studies. By following these steps, you can create a robust SLR that adheres to academic and professional standards.


 Steps to Write a Systematic Literature Review

Understanding Systematic Literature Reviews

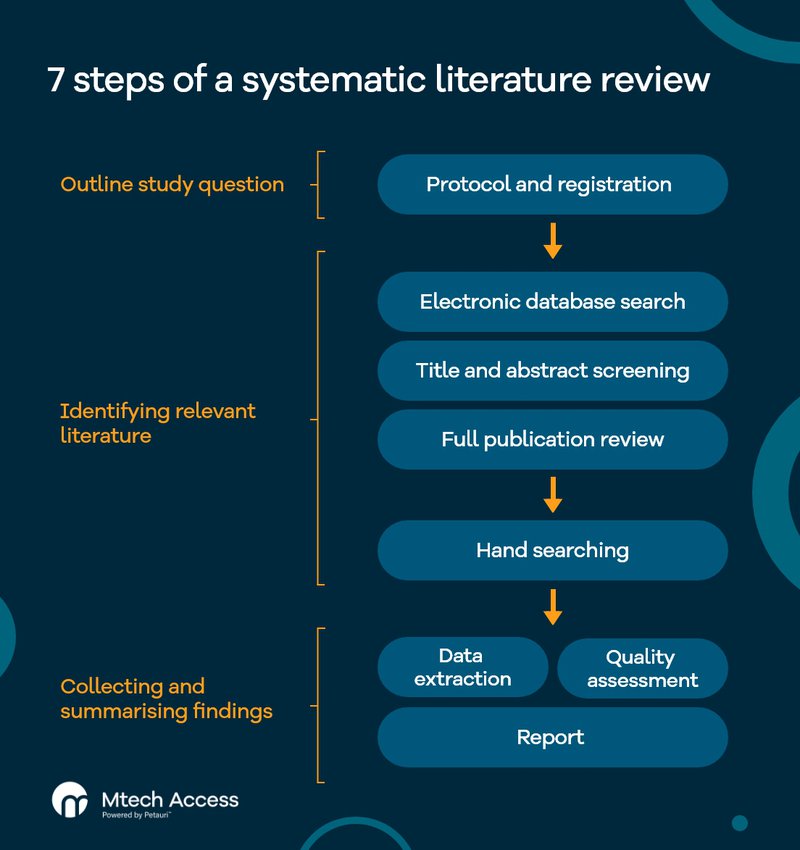
A systematic literature review is a type of research methodology that collects, evaluates, and synthesizes all available evidence on a specific research question. Unlike traditional narrative reviews, SLRs use a transparent and rigorous process to minimize bias and ensure reproducibility. For instance, the “7 steps of systematic review” framework provides a comprehensive roadmap for conducting SLRs systematically.


Importance of Systematic Literature Reviews

SLRs play a pivotal role in various disciplines, particularly in medicine, where evidence-based practices are paramount. For example, a systematic literature review PDF focusing on the efficacy of a new drug offers a clear and concise synthesis of all relevant clinical trials. Researchers can then rely on such reviews to inform policy decisions, guideline development, or further investigation.


Noteworthy Steps to Write a Systematic Literature Review

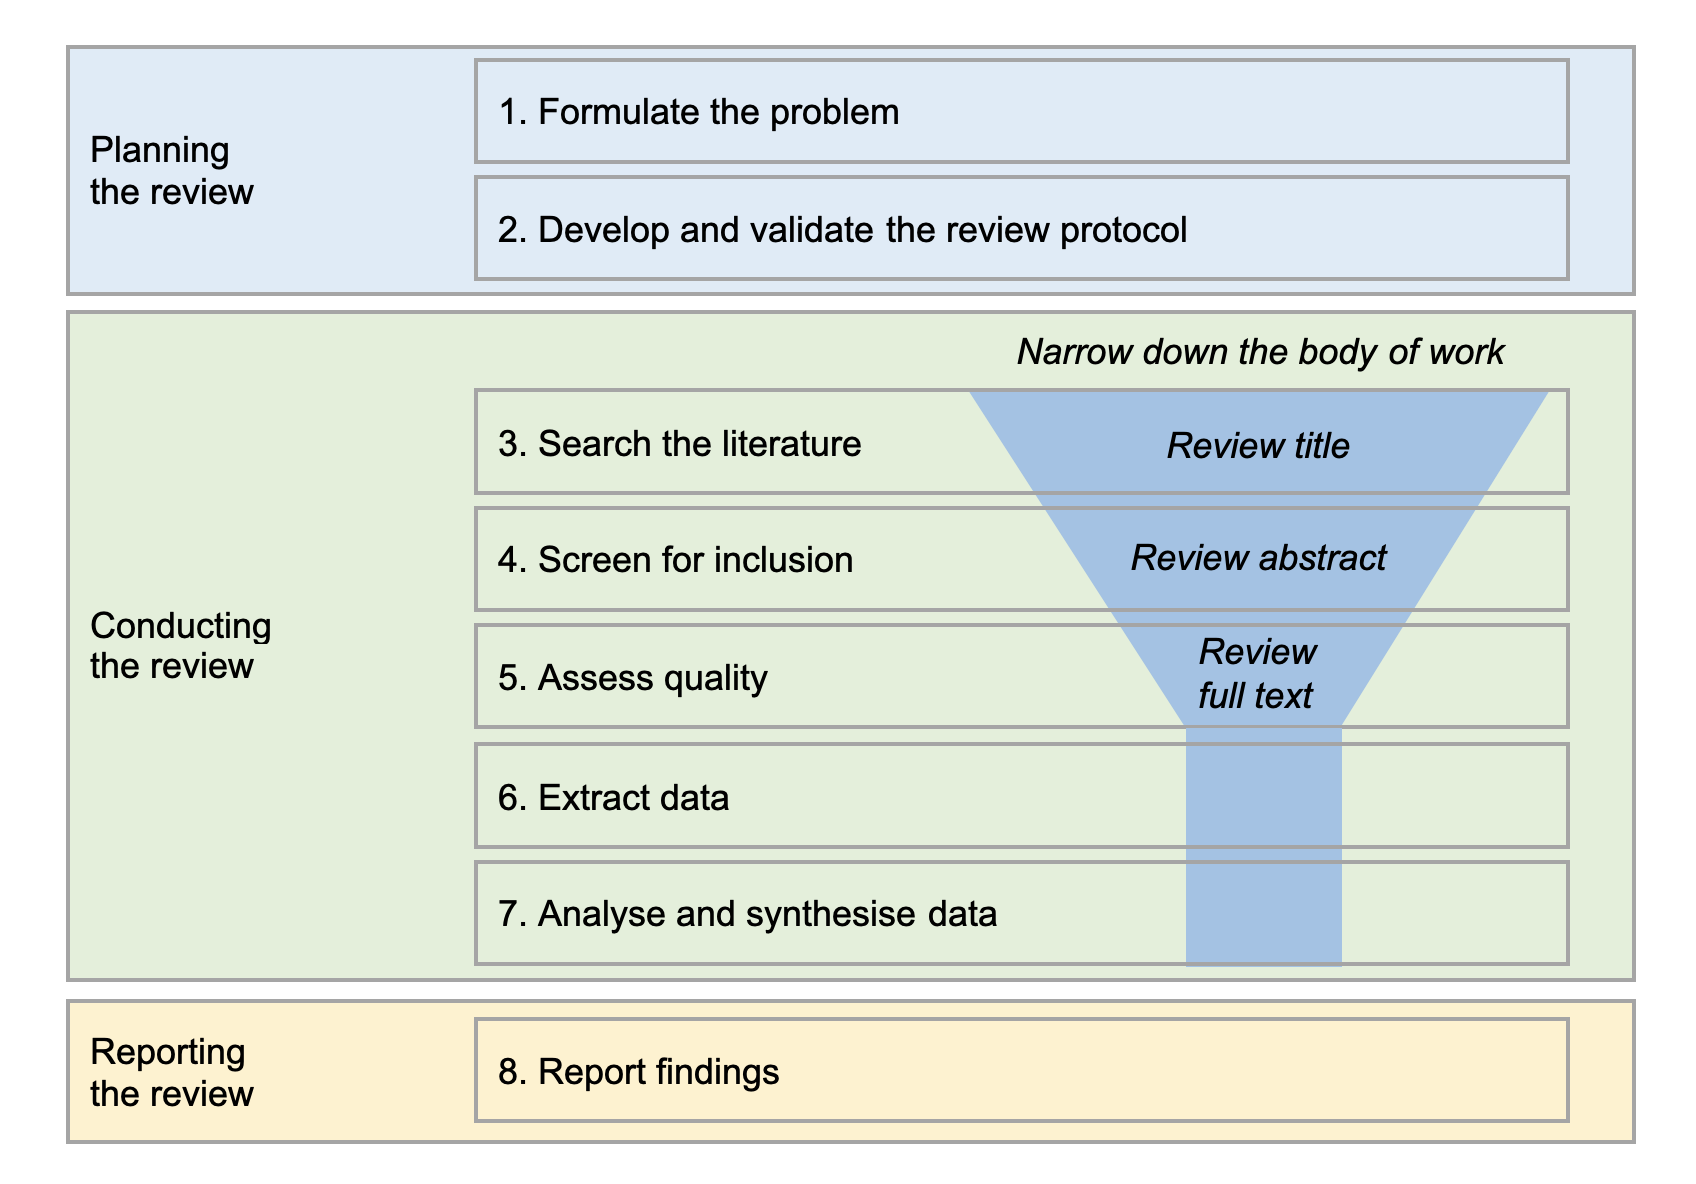
Below are the detailed steps involved in writing an SLR. These steps align with established frameworks like the “6 steps in conducting a systematic review” and “7 steps of systematic review.”

Define the Research Question

The foundation of an SLR lies in a clear, focused research question. Use the PICOS (Population, Intervention, Comparison, Outcome, Study design) framework to formulate your question, particularly in medical research. For instance, a research question could be:

“What is the effectiveness of cognitive-behavioral therapy compared to pharmacotherapy in treating anxiety disorders?”

Develop a Protocol

A systematic review protocol outlines the methods and processes you’ll follow, ensuring transparency and reducing bias. The protocol should include:

  • Research objectives
  • Inclusion and exclusion criteria
  • Search strategy
  • Data extraction and synthesis methods

Consider registering your protocol on platforms like PROSPERO to enhance credibility.

Conduct a Comprehensive Literature Search

Perform a thorough search across multiple databases such as PubMed, Scopus, and Web of Science. Use a combination of keywords, Boolean operators, and controlled vocabulary to ensure comprehensive coverage. For example:

  • Keywords: “systematic literature review example,” “systematic literature review sample PDF,” “6 steps in conducting a systematic review.”
  • Boolean Search: (“Systematic literature review” OR “SLR”) AND (“methodology” OR “example”)

Screen and Select Studies

Use predefined inclusion and exclusion criteria to screen studies. Tools like PRISMA (Preferred Reporting Items for Systematic Reviews and Meta-Analyses) flow diagrams can help document the selection process. Ensure:

  • Titles and abstracts are screened for relevance.
  • Full-text reviews confirm eligibility.

Assess the Quality of Included Studies

Evaluate the quality and risk of bias in the selected studies using established tools like the Cochrane Risk of Bias Tool or Newcastle-Ottawa Scale. This step is crucial for ensuring the reliability of your findings.

Extract Data

Develop a standardized data extraction form to collect key information, such as:

  • Study design
  • Sample characteristics
  • Interventions
  • Outcomes

Synthesize and Analyze Data

Data synthesis can be qualitative or quantitative (meta-analysis). Choose an appropriate approach based on the nature of your studies. Use software like RevMan or NVivo for data analysis. Ensure your synthesis highlights patterns, discrepancies, and gaps in the literature.

Report Results

Present your findings in a structured manner using established guidelines like PRISMA. Include sections such as:

  • Abstract
  • Introduction
  • Methods
  • Results
  • Discussion
  • Conclusion

Interpret and Discuss Findings

Discuss the implications of your findings, limitations of your review, and recommendations for future research. For example, a systematic literature review PDF on a new treatment might emphasize the need for larger, high-quality randomized trials.

Publish and Disseminate

Submit your SLR to relevant journals or share it via academic platforms. Publishing enhances the visibility and impact of your research.


 Steps to Write a Systematic Literature Review

Systematic Literature Review Methodology: An Example

To illustrate the process, consider a systematic literature review example focusing on “The Effectiveness of Telemedicine in Chronic Disease Management.”

Step 1: Define Research Question

“How effective is telemedicine in improving health outcomes for patients with chronic diseases?”

Step 2: Develop Protocol

The protocol specifies databases (e.g., PubMed, Embase), inclusion criteria (e.g., randomized controlled trials, studies published in English), and analysis methods.

Step 3: Literature Search

Search terms: “telemedicine,” “chronic disease management,” “systematic review.”

Step 4: Screen Studies

Use PRISMA to document the selection of 50 studies from an initial pool of 500.

Step 5: Assess Quality

Apply the Cochrane Risk of Bias Tool to assess study reliability.

Step 6: Extract Data

Key outcomes: patient satisfaction, hospitalization rates, and cost-effectiveness.

Step 7: Synthesize Data

A meta-analysis reveals telemedicine’s significant impact on reducing hospitalizations by 20%.

Step 8: Report Results

The findings are presented in a systematic literature review PDF, structured per PRISMA guidelines.


 Steps to Write a Systematic Literature Review

Resources for Writing Systematic Literature Reviews

Systematic Literature Review Sample PDFs

  • Access examples from reputable journals to understand formatting and reporting standards.

Software Tools

  • EndNote: For managing references.
  • Covidence: For screening studies.
  • RevMan: For conducting meta-analyses.

Guidelines and Frameworks

  • PRISMA for reporting.
  • Cochrane Handbook for methodology.

Challenges in Writing Systematic Literature Reviews

While SLRs are invaluable, they pose challenges such as:

  • Time-intensive processes.
  • Difficulty in accessing full-text articles.
  • Managing large volumes of data.

Overcoming these challenges requires meticulous planning, access to robust resources, and collaboration.


 Steps to Write a Systematic Literature Review

Conclusion

Writing a systematic literature review involves a rigorous and transparent process to synthesize existing research. By following the “6 steps in conducting a systematic review” or the “7 steps of systematic review,” researchers can ensure their work is comprehensive, reliable, and impactful. Leveraging resources such as systematic literature review sample PDFs and methodological guidelines enhances the quality and credibility of the review. Whether you are exploring how to write a systematic literature review as a guide for medical research or other fields, adhering to these steps will lead to success in producing a high-quality SLR.

Needs help with similar assignment?

We are available 24x7 to deliver the best services and assignment ready within 3-4 hours? Order a custom-written, plagiarism-free paper

Get Answer Over WhatsApp Order Paper Now

Complete Statistical Assignment in the Least Possible Time|2025

Learn how to complete statistical assignment in the least possible time with SPSS help. Discover expert tips and tools to streamline data analysis and meet tight deadlines efficiently.

Statistical analysis is a cornerstone of modern research and data-driven decision-making. As a student or professional, the challenge often lies in completing statistical assignments efficiently and accurately. SPSS (Statistical Package for the Social Sciences) is one of the most widely used software tools for statistical analysis, offering a user-friendly interface and robust capabilities. This paper explores strategies for completing statistical assignments in the least possible time with SPSS help, incorporating practical examples and valuable resources such as SPSS assignment PDFs, SPSS data analysis examples, and SPSS practical exam questions.

Complete Statistical Assignment in the Least Possible Time

Understanding the Basics of SPSS

SPSS is designed to simplify the process of statistical analysis, enabling users to manage data, perform statistical tests, and generate visualizations with ease. To leverage SPSS effectively for completing assignments, one must first understand its core features:

  1. Data Input: SPSS allows users to input data manually or import it from various sources such as Excel, CSV, and databases.
  2. Data Transformation: It supports functions like recoding variables, computing new variables, and handling missing data.
  3. Statistical Tests: SPSS provides a wide range of statistical tests, including descriptive statistics, regression analysis, and ANOVA.
  4. Output Interpretation: The software generates outputs in tables and graphs, which are easy to interpret and include in reports.

Steps to Complete Statistical Assignments Quickly Using SPSS

  1. Understand the Assignment Requirements: Before diving into SPSS, carefully read the assignment guidelines. Clarify the objectives, statistical tests required, and deliverables. For guidance, refer to SPSS assignment examples or SPSS questions and answers PDFs free for download.
  2. Organize Your Data: Clean and prepare your dataset before importing it into SPSS. Ensure that the variables are correctly labeled and that missing values are handled appropriately. Resources like SPSS data analysis examples PDFs can provide insights into effective data organization.
  3. Leverage SPSS Tutorials and Help Resources: If you’re new to SPSS or facing challenges, use tutorials, online forums, or SPSS assignment help services. Many SPSS assignment PDFs include step-by-step instructions for common analyses.
  4. Use SPSS Templates and Macros: Pre-built templates and macros can save significant time by automating repetitive tasks. For instance, SPSS analysis for questionnaire PDFs often include templates tailored for survey data.
  5. Perform and Verify Statistical Tests: Use SPSS to perform the required analyses. Double-check the results to ensure accuracy. For practice, review SPSS practical exam questions PDFs to test your understanding.
  6. Interpret and Report Results: SPSS outputs can be directly copied into reports. Use clear, concise language to explain findings. Refer to SPSS assignment examples for formatting and interpretation tips.

Common SPSS Tasks in Statistical Assignments

  1. Descriptive Statistics:
    • Task: Summarize data using measures like mean, median, standard deviation, and frequency distributions.
    • Example: Analyzing customer demographics in a marketing survey.
    • Resource: SPSS questions and answers PDFs free download can guide you through common descriptive statistics questions.
  2. Hypothesis Testing:
    • Task: Test hypotheses using t-tests, chi-square tests, or ANOVA.
    • Example: Comparing the average test scores of two student groups.
    • Resource: SPSS practical exam questions PDFs often include hypothesis testing scenarios.
  3. Regression Analysis:
    • Task: Identify relationships between dependent and independent variables.
    • Example: Examining factors influencing employee performance.
    • Resource: SPSS data analysis examples PDFs provide practical insights into regression applications.
  4. Survey Data Analysis:
    • Task: Analyze responses from questionnaires using frequency analysis, cross-tabulation, and reliability tests.
    • Example: Evaluating customer satisfaction levels.
    • Resource: SPSS analysis for questionnaire PDFs offer detailed guides for survey data analysis.

Tools and Resources to Enhance Efficiency

  1. SPSS Assignment PDFs: These resources contain detailed explanations, solved examples, and practice questions to help users understand various SPSS features and applications.
  2. SPSS Data Analysis Examples PDFs: Real-world examples of SPSS analyses provide practical insights and help users replicate similar approaches in their assignments.
  3. SPSS Practical Exam Questions PDFs: Practicing with these questions can improve proficiency and prepare users for time-sensitive tasks.
  4. Online SPSS Assignment Help: Numerous platforms offer professional assistance, providing solutions tailored to specific requirements.

Complete Statistical Assignment in the Least Possible Time

Case Study: Using SPSS for Questionnaire Analysis

To illustrate the practical application of SPSS, consider a case study involving questionnaire analysis:

  • Scenario: A researcher conducts a survey to evaluate employee job satisfaction across departments.
  • Steps:
    1. Import the questionnaire data into SPSS.
    2. Perform frequency analysis to summarize responses.
    3. Use cross-tabulation to compare satisfaction levels across departments.
    4. Conduct reliability analysis to assess the consistency of the questionnaire.
    5. Generate graphs and tables for reporting.
  • Outcome: The researcher identifies key factors influencing job satisfaction and provides actionable recommendations.
  • Resource: SPSS analysis for questionnaire PDFs offer templates and examples for similar analyses.

Overcoming Common Challenges

  1. Data Preparation: Ensure data is clean and well-structured before analysis. Tutorials and SPSS assignment examples can provide guidance.
  2. Software Navigation: Familiarize yourself with SPSS menus and options through tutorials or SPSS questions and answers PDFs free download.
  3. Result Interpretation: Use SPSS outputs effectively by referring to examples and guides.
  4. Time Management: Break the assignment into smaller tasks and use resources like SPSS practical exam questions PDFs to stay on track.

Complete Statistical Assignment in the Least Possible Time

Conclusion

Completing a statistical assignment in the least possible time requires a combination of preparation, practice, and efficient use of tools like SPSS. By leveraging resources such as SPSS assignment PDFs, SPSS data analysis examples, and SPSS practical exam questions, users can streamline their workflow and achieve accurate results. Whether you’re analyzing survey data, testing hypotheses, or summarizing descriptive statistics, SPSS provides the capabilities to handle complex tasks with ease. With practice and the right resources, mastering SPSS becomes an achievable goal for any student or professional.

Needs help with similar assignment?

We are available 24x7 to deliver the best services and assignment ready within 3-4 hours? Order a custom-written, plagiarism-free paper

Get Answer Over WhatsApp Order Paper Now

The Importance of Clear Research Questions in Data Analysis|2025

Understand the importance of clear research questions in data analysis. Learn how well-defined questions guide your study, improve focus, and lead to accurate and meaningful results.

Data analysis is an essential part of research in various fields such as science, social studies, business, and healthcare. It involves examining, interpreting, and drawing conclusions from data. However, the success and quality of data analysis are heavily dependent on how well the research questions are defined. A clear and well-structured research question is crucial because it provides direction, focus, and scope to the analysis process. In this paper, we will explore the significance of clear research questions in data analysis, discuss what makes a research question effective, and present examples of various types of research questions that guide data analysis, such as explanatory research questions.

The Importance of Clear Research Questions in Data Analysis

Understanding Research Questions

A research question is the central question that a study seeks to answer. It defines the problem that the research will address, and guides the methodology, data collection, and analysis process. A research question is fundamental because it narrows down the vast field of inquiry to a specific area that can be addressed systematically. Without a well-defined question, researchers may struggle with focus, data gathering, and ultimately drawing meaningful conclusions.

What is a Research Question? A research question is a clearly defined query that the researcher aims to answer through the collection and analysis of data. It specifies the focus of the investigation and guides every aspect of the research. An effective research question identifies the key variables, defines the scope of the study, and suggests the type of research design that will be most suitable.

Research Questions in Qualitative vs. Quantitative Research Research questions are crucial in both qualitative and quantitative research but differ in focus and design. In qualitative research, questions often explore phenomena in depth, seeking to understand experiences, perceptions, or social contexts. They are typically open-ended and exploratory, such as, “How do patients perceive their healthcare providers in rural settings?” In contrast, quantitative research questions are more specific and seek to measure the relationship between variables or test hypotheses, such as, “What is the effect of exercise on blood pressure in middle-aged adults?”

The Importance of Clear Research Questions in Data Analysis

The importance of research questions in data analysis cannot be overstated. Clear research questions provide the framework for the entire study, from hypothesis formulation to the final interpretation of results. The clarity of these questions directly impacts the research’s effectiveness and efficiency. Let’s delve into some key reasons why clear research questions are essential in data analysis:

Guiding the Research Process A well-crafted research question serves as a roadmap, guiding researchers through the entire study. It defines the study’s focus, helping to determine what data should be collected and how the data will be analyzed. When research questions are clear, researchers are better able to design appropriate methodologies and choose the right statistical or analytical tools. Conversely, unclear or overly broad questions can lead to ambiguity in data collection and analysis, often resulting in inconclusive or irrelevant findings.

Providing Focus and Direction Clear research questions help researchers maintain focus by delineating the scope of the study. A specific research question ensures that the analysis remains relevant and prevents the researcher from straying into unrelated areas. For example, a research question like “What factors influence employee productivity in tech companies?” focuses the study on specific factors, while a vague question like “What influences productivity?” could lead to a broader and less manageable analysis.

Facilitating Data Collection and Methodology Selection The clarity of a research question is instrumental in selecting the most appropriate methodology and data collection methods. A well-defined question indicates whether the research should rely on qualitative methods (e.g., interviews, case studies) or quantitative methods (e.g., surveys, statistical analysis). Furthermore, clear questions allow researchers to identify which variables need to be measured and how data should be structured for analysis.

Avoiding Data Overload In many cases, researchers collect vast amounts of data, but only a small portion of it is relevant to answering the research question. Clear research questions help researchers avoid data overload by focusing on only the most relevant and impactful variables. By narrowing the scope of the inquiry, researchers can ensure that data analysis is manageable, efficient, and directly tied to the research objectives.

Ensuring Relevance to Stakeholders In applied research fields, clear research questions also help ensure that the study’s results are relevant to stakeholders such as policymakers, businesses, or healthcare professionals. By aligning the research questions with the needs of the stakeholders, researchers can ensure that the findings are actionable and beneficial in real-world contexts.

The Importance of Clear Research Questions in Data Analysis

What Makes a Research Question Effective?

An effective research question is one that is clear, focused, and feasible. Several characteristics contribute to the effectiveness of a research question:

Clarity A good research question is unambiguous and easy to understand. It clearly defines the problem the research seeks to address and avoids vagueness or unnecessary complexity. For example, instead of asking, “How does social media impact society?” a clearer question would be, “What is the effect of social media use on mental health among teenagers?”

Focus An effective research question is specific and narrow in scope. It focuses on a particular aspect of a broader topic, making it possible to address the issue in detail. A focused question ensures that the study remains manageable and avoids spreading the research too thin. For instance, rather than asking, “What are the effects of climate change?” a more focused question would be, “How does climate change affect the frequency of wildfires in California?”

Feasibility A research question must be feasible, meaning that it can be answered using the available resources, data, and time frame. An overly ambitious question may not be practical to investigate, especially if it requires resources or data that are not accessible. For example, a question like “What is the global impact of climate change on biodiversity?” may be too broad to answer in a single study, while a more feasible question could be “How has climate change affected the biodiversity of coral reefs in the Pacific Ocean?”

Relevance The research question should address an issue that is important to the field of study, relevant to the stakeholders, and capable of contributing to existing knowledge. It should also be timely and aligned with current research trends or societal needs.

Types of Research Questions

Research questions can be classified into different types based on the purpose of the study and the methods used to answer them. These types include exploratory, descriptive, explanatory, and analytical research questions. Let’s explore each one in more detail:

Exploratory Research Questions Exploratory research questions are designed to investigate a new or poorly understood phenomenon. They seek to explore ideas, patterns, or concepts without making predictions or testing hypotheses. These questions are typically open-ended and qualitative in nature. For example, an exploratory research question could be, “What challenges do small businesses face when transitioning to digital marketing?” These questions allow for in-depth exploration and provide insights into areas that require further investigation.

Descriptive Research Questions Descriptive research questions aim to describe the characteristics or features of a phenomenon. These questions seek to answer the “what” of the study, such as, “What is the demographic profile of voters in the 2024 U.S. presidential election?” Descriptive questions help researchers gather data that provides a snapshot of the current state of affairs without necessarily explaining the causes or relationships behind the phenomenon.

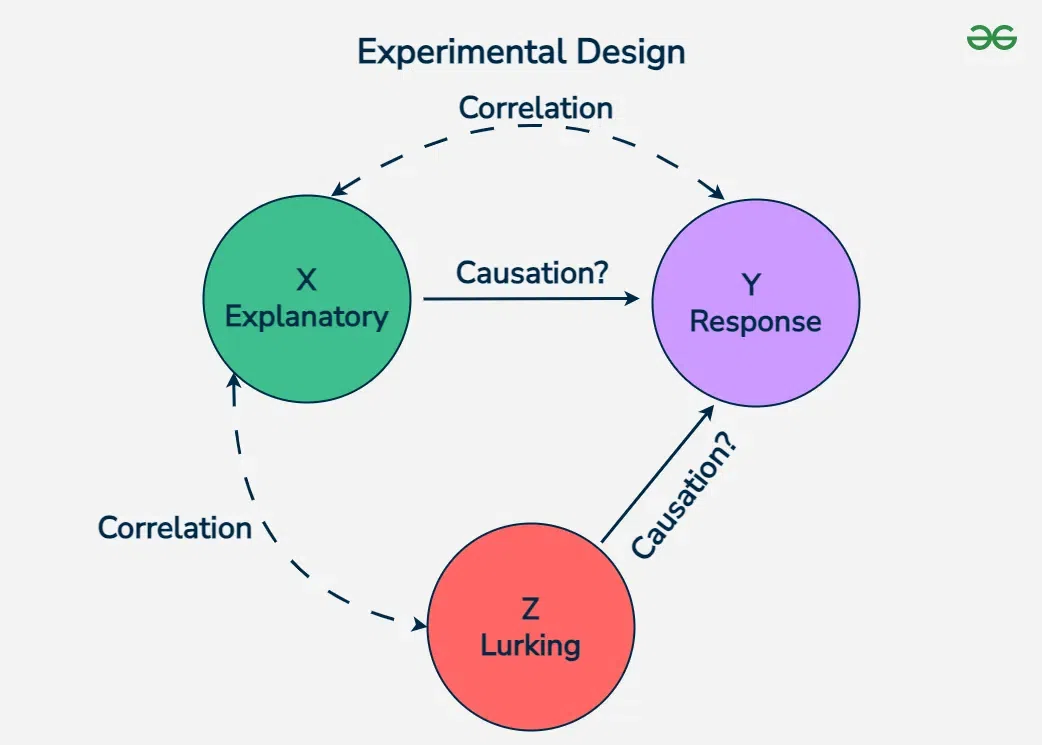
Explanatory Research Questions Explanatory research questions seek to explain the cause-and-effect relationships between variables. These questions often involve hypotheses and are typically quantitative in nature. An example of an explanatory research question is, “How does exercise frequency affect the cholesterol levels of middle-aged adults?” This type of question seeks to determine the underlying mechanisms that drive certain outcomes and is often associated with experimental or longitudinal studies.

Analytical Research Questions Analytical research questions are used to evaluate or compare different aspects of a phenomenon. These questions may involve comparing data across different groups or time periods. For example, “How do marketing strategies differ between successful and unsuccessful startups?” Analytical questions require a more sophisticated approach to data analysis and often involve statistical tools.

Research Question Examples

Research Questions in Quantitative Research:

  • “What is the relationship between smoking and lung cancer rates in adults?”
  • “How does income level influence educational attainment in urban areas?”

Research Questions in Qualitative Research:

  • “What are the experiences of refugees living in urban areas?”
  • “How do social media platforms shape teenagers’ self-esteem?”

Explanatory Research Question Examples:

  • “What factors contribute to employee burnout in the healthcare sector?”
  • “How does access to clean water impact childhood health in rural communities?”

The Importance of Clear Research Questions in Data Analysis

Conclusion

Clear research questions are the foundation of effective data analysis. They help researchers focus their efforts, select appropriate methodologies, and gather relevant data. The clarity, focus, feasibility, and relevance of research questions are essential for guiding the research process and ensuring meaningful results. Whether conducting qualitative or quantitative research, the importance of well-defined research questions cannot be overstated. Researchers who take the time to formulate precise and effective questions will find that their data analysis becomes more structured, insightful, and valuable to the broader research community.

Needs help with similar assignment?

We are available 24x7 to deliver the best services and assignment ready within 3-4 hours? Order a custom-written, plagiarism-free paper
Get Answer Over WhatsApp Order Paper Now

Balancing Coursework and Data Analysis Projects|2025

Discover tips for balancing coursework and data analysis projects. Learn strategies to manage your time, stay organized, and excel in both academic tasks efficiently.

Balancing coursework with data analysis projects can be a significant challenge for students, professionals, and anyone trying to manage multiple responsibilities at once. Data analysis is an essential skill that is increasingly relevant in almost every field today, and its complexity often requires substantial time, effort, and focus. Coursework, on the other hand, provides the foundational knowledge and structure for understanding theoretical concepts in a given field. This paper explores how to structure and manage both academic coursework and data analysis projects effectively, detailing the steps involved in data analysis, the activities that it entails, and the key considerations for presenting a data analysis project.

Balancing Coursework and Data Analysis Projects

Introduction

Students, analysts, and researchers often face the challenge of balancing academic coursework with practical data analysis projects. The increasing demand for data-driven insights across industries places great emphasis on the development of analytical skills. In particular, fields such as business, healthcare, social sciences, engineering, and technology rely heavily on data to inform decisions, predict outcomes, and improve processes.

However, while academic coursework imparts valuable theoretical knowledge and domain expertise, data analysis projects require a different skill set. These projects require critical thinking, problem-solving, and the application of various tools and techniques for analyzing, interpreting, and presenting data. Striking a balance between these two demands can be a daunting task, especially when deadlines and expectations for both aspects overlap. Therefore, students and professionals must learn how to effectively structure their time, manage resources, and integrate their academic knowledge with practical applications.

How to Structure a Data Analysis Project

Structuring a data analysis project is crucial for ensuring that the project is organized, efficient, and focused. Whether you are a student working on a term project or a professional dealing with a complex dataset, a clear structure provides a roadmap that guides the project from start to finish.

  1. Understanding the Problem and Setting Objectives: The first step in structuring a data analysis project is understanding the problem at hand. What are the goals of the analysis? What specific questions are you trying to answer? Clear objectives should be established at the beginning of the project to ensure that the analysis stays focused and aligned with the overall goals.
  2. Data Collection and Acquisition: The next step involves gathering the relevant data for the analysis. This could involve collecting data from various sources such as surveys, experiments, open data repositories, or internal databases. The quality of the data is crucial to the success of the analysis, so data should be carefully selected, ensuring that it is accurate, complete, and relevant to the problem at hand.
  3. Data Cleaning and Preprocessing: Data often comes with inconsistencies, missing values, or errors that can affect the analysis. Therefore, data cleaning and preprocessing are essential steps in any data analysis project. This step may involve handling missing data, removing outliers, correcting errors, and transforming the data into a format suitable for analysis.
  4. Exploratory Data Analysis (EDA): Before diving into advanced analysis, it’s important to perform exploratory data analysis. This involves visualizing the data and looking for patterns, trends, correlations, and anomalies. EDA can help you better understand the underlying structure of the data and identify potential areas for further analysis.
  5. Choosing the Right Analytical Techniques: Depending on the nature of the problem and the data at hand, you will need to select appropriate analytical techniques. For example, you may choose statistical methods such as regression analysis or machine learning techniques like classification or clustering. It is important to choose the right methods based on the objectives of the project and the characteristics of the data.
  6. Modeling and Analysis: Once the analysis techniques have been chosen, you can proceed to build models or apply algorithms to the data. This phase often involves training models, testing different hypotheses, and evaluating the results based on predefined metrics.
  7. Interpreting Results: The interpretation phase is crucial in data analysis. The results of the analysis must be evaluated in the context of the original objectives. It’s important to draw conclusions that are meaningful and actionable based on the findings. Interpretation may also involve comparing the results with benchmarks or other studies to validate the findings.
  8. Presentation and Reporting: The final step is to communicate the results of the analysis. This may involve writing a report, creating visualizations such as graphs or charts, and presenting the findings to stakeholders. A good presentation should not only highlight the key findings but also explain the methodology, assumptions, and limitations of the analysis.

Balancing Coursework and Data Analysis Projects

Steps Involved When Working with a Data Analysis Project

Data analysis projects typically involve several distinct stages, each requiring a different set of skills. Below is a detailed outline of the key steps involved in working on a data analysis project:

Problem Definition

Before beginning any data analysis project, it is essential to clearly define the problem. This stage involves understanding the research question or the business problem that the data analysis seeks to address. Defining the problem will help to ensure that the right data is collected, and the appropriate methods are used. A well-defined problem also ensures that the analysis is aligned with the project’s objectives.

Data Collection and Acquisition

Data collection is the next critical step. In this stage, you gather the necessary data from various sources. Depending on the nature of the project, data collection might involve surveys, interviews, extracting data from databases, or scraping data from websites. It’s essential to ensure that the data is relevant, complete, and accurate.

Data Cleaning and Preprocessing

Data cleaning and preprocessing are time-consuming but necessary steps in the data analysis process. The data you collect may have missing values, duplicates, inconsistencies, or errors that need to be addressed. You may also need to normalize or standardize the data to make it suitable for analysis. This step is vital for ensuring that the analysis yields reliable and valid results.

Data Exploration

Exploratory data analysis (EDA) involves examining the dataset in a visual and statistical manner to identify patterns and relationships. Common techniques include plotting histograms, box plots, scatter plots, and calculating summary statistics. This step can also help identify any outliers or anomalies that may require special attention.

Modeling and Analysis

Once the data has been cleaned and explored, the next step is to apply appropriate modeling and analytical techniques. This could involve using statistical methods such as regression analysis or machine learning algorithms like clustering or decision trees. The goal is to extract meaningful insights from the data by applying the most suitable methods.

Evaluation and Validation

After applying models or algorithms, it’s essential to evaluate the results. This can be done by using validation techniques such as cross-validation, testing the model on new data, or comparing it against established benchmarks. The evaluation step helps determine whether the model is performing as expected and if adjustments need to be made.

Interpretation of Results

The interpretation of the results is a critical stage in data analysis. Here, you draw conclusions based on the data and the analysis performed. The interpretation should be linked to the original problem definition and objectives. Any limitations or uncertainties in the analysis should also be addressed.

Communication of Results

Finally, the results of the analysis must be communicated effectively. This involves creating reports, visualizations, and presentations that clearly convey the findings to stakeholders. Effective communication ensures that the insights gained from the analysis can be used to inform decisions or drive action.

Activities Involved in Data Analysis

Several key activities are involved in a data analysis project, and they can vary depending on the scope and complexity of the project. Some of the core activities include:

  • Data Collection: Gathering the data from various sources, such as internal databases, external datasets, surveys, and web scraping.
  • Data Cleaning: Identifying and addressing issues in the data, such as missing values, inconsistencies, and outliers.
  • Data Exploration: Visualizing the data and performing statistical analysis to identify trends, relationships, and potential issues.
  • Modeling and Analysis: Applying statistical or machine learning models to analyze the data and extract meaningful insights.
  • Validation and Testing: Evaluating the model or analysis results to ensure they are accurate and reliable.
  • Result Interpretation: Drawing conclusions from the analysis and ensuring that the results align with the original problem statement.
  • Reporting and Presentation: Communicating the findings through reports, charts, and presentations to stakeholders.

Balancing Coursework and Data Analysis Projects

How to Present a Data Analysis Project

Presenting a data analysis project effectively is just as important as performing the analysis itself. A well-organized presentation ensures that your audience understands the methodology, results, and significance of your findings. Here are some key considerations for presenting a data analysis project:

Structure Your Presentation Clearly

Begin by structuring your presentation in a clear and logical manner. A typical structure includes:

  • Introduction: Introduce the problem, objectives, and the context of the analysis.
  • Methodology: Describe the methods and tools used in the analysis, including data collection, preprocessing, and modeling techniques.
  • Results: Present the key findings using visualizations (charts, graphs, tables) to make the results easier to understand.
  • Conclusion: Summarize the insights gained from the analysis and any recommendations or implications.

Use Visualizations Effectively

Data visualization is a powerful tool for communicating the results of an analysis. Use clear and concise charts, graphs, and tables to illustrate key trends, correlations, and insights. Choose the appropriate type of visualization for the data and the message you want to convey.

Explain Your Methodology

Explain the steps you took during the analysis, including data cleaning, preprocessing, and the modeling techniques used. This helps the audience understand how you arrived at your conclusions and builds confidence in the accuracy and reliability of the results.

Be Clear and Concise

Keep your presentation clear and to the point. Avoid jargon and technical language unless necessary, and focus on delivering the key insights in a way that is easy to understand. Aim for simplicity, especially when presenting to non-technical audiences.

Provide Context

Explain the significance of the findings in the context of the problem. How do the results answer the original question or solve the problem at hand? If applicable, provide recommendations or implications for decision-making based on the analysis.

Be Prepared for Questions

Finally, be ready to answer any questions from your audience. Be prepared to explain your methodology in more detail, address any concerns about data quality or assumptions, and clarify any points that may not be immediately clear.

Balancing Coursework and Data Analysis Projects

Conclusion

Balancing coursework with data analysis projects requires careful planning, time management, and organization. Structuring a data analysis project involves defining the problem, collecting and cleaning data, applying appropriate analytical techniques, and presenting the results effectively. Understanding the steps involved in data analysis and the activities associated with it is crucial for success. Moreover, presenting a data analysis project requires clear communication of both the methodology and the insights gained from the analysis. By mastering these skills, students and professionals can successfully balance coursework with practical data analysis, making the most of both academic and practical opportunities.

Needs help with similar assignment?

We are available 24x7 to deliver the best services and assignment ready within 3-4 hours? Order a custom-written, plagiarism-free paper
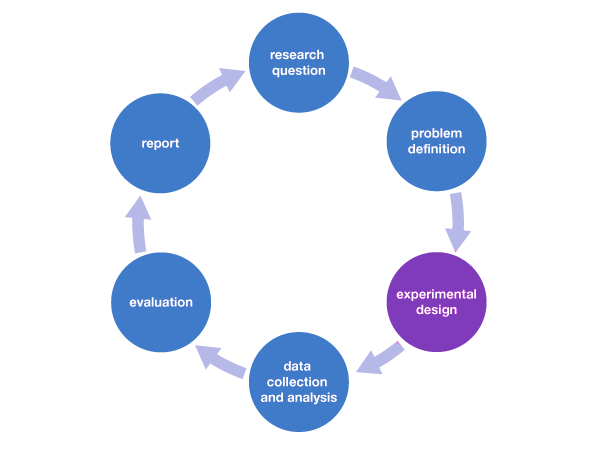
Get Answer Over WhatsApp Order Paper Now

Resource Constraints in Student Data Analysis Projects|2025

Explore the impact of resource constraints in student data analysis projects, including limited tools, time, and data access. Learn strategies to overcome challenges and maximize project outcomes effectively.

In today’s educational landscape, data analysis plays an essential role in various academic projects. For students, engaging in data analysis projects helps develop critical thinking, problem-solving abilities, and technical skills in areas such as data collection, interpretation, and presentation. However, as students embark on these projects, they often encounter resource constraints that can affect the quality and depth of their analysis. These constraints can be financial, technical, or even related to access to data, all of which pose significant challenges. This paper explores the concept of resource constraints in student data analysis projects, their impact on project outcomes, and strategies to overcome them.

The keywords mentioned above will be used in the context of the challenges and opportunities students face in their data analysis projects and the solutions available to help alleviate the difficulties posed by resource constraints.

Resource Constraints in Student Data Analysis Projects

The Importance of Data Analysis in Student Projects

Data analysis has become a vital aspect of student research across many disciplines, including economics, business, social sciences, and engineering. It allows students to understand trends, make informed decisions, and communicate their findings effectively. In projects, students collect data, analyze it using various statistical and analytical tools, and present their results in formats like reports, presentations, and papers.

In most cases, the presentation of data analysis is done through tools such as PowerPoint (PPT), PDFs, and other formats that allow students to present their findings clearly. The availability of resources such as software, data sets, and computational tools can significantly influence the success of these projects. However, students often face challenges in acquiring the necessary resources, which can hinder the quality of their analysis and presentations.

Resource Constraints in Student Data Analysis Projects

Financial Constraints

One of the most significant resource constraints students face is the financial limitation. Data analysis tools, software, and datasets are often expensive, which may not be feasible for students, especially those on a tight budget. Software like Microsoft Excel, R, SPSS, and SAS require licenses that can be costly. Additionally, many datasets that students use for analysis are behind paywalls or require a subscription.

For instance, students working on data analysis projects for business or economics courses may need access to proprietary databases such as Bloomberg, Nielsen, or Statista. These databases often charge high fees, making them inaccessible to many students. The lack of access to such data can limit the scope and depth of analysis, thereby affecting the quality of the project.

Technical Constraints

In many cases, students lack access to the high-powered computing resources required for large-scale data analysis. This is particularly true in fields like machine learning, where students may need to perform computationally intensive tasks, such as training complex algorithms on large datasets. Without access to high-performance computers or servers, students may be forced to scale down their analysis or use less sophisticated methods, which can compromise the quality of their work.

Moreover, technical skills such as data cleaning, programming, and the use of specialized analysis software are critical for successful data analysis. Students without the necessary training may struggle to make the most of available tools and resources. Even if they have access to software like R, Python, or Tableau, they might not have the expertise to use these tools effectively.

Data Availability and Access

Another significant constraint is the lack of access to relevant and quality data. In many cases, data is not readily available, or students have limited access to datasets that are pertinent to their research question. Open-source data repositories exist, but these datasets might not be comprehensive enough to answer complex research questions. Students often find themselves having to resort to less-reliable secondary sources, which can undermine the validity of their analysis.

In fields such as social sciences or health studies, data privacy and ethical considerations further complicate access to sensitive data. Institutional review boards (IRBs) or ethics committees frequently impose restrictions on the use of certain data, which limits students’ ability to conduct comprehensive analyses.

Time Constraints

Students working on data analysis projects are often juggling multiple responsibilities, including coursework, internships, part-time jobs, and other personal commitments. As a result, the time allocated to their data analysis projects is often limited. Data analysis can be a time-consuming process, involving data cleaning, coding, visualization, and interpretation, all of which require careful attention and adequate time.

When students are constrained by time, they may resort to shortcuts, using limited datasets or choosing less complex methods of analysis to meet deadlines. This can result in incomplete or shallow analyses, which affect the overall quality of their work.

Resource Constraints in Student Data Analysis Projects

Impact of Resource Constraints on Student Projects

Resource constraints can have a significant impact on the outcome of student data analysis projects. The limitations mentioned above can affect various aspects of the project, including:

Quality of Data Analysis and Results

If students do not have access to the necessary resources, their analysis may lack depth, and the results may not be as reliable or comprehensive. For example, students without access to advanced statistical software may use basic tools that do not allow them to conduct complex analyses. As a result, their findings may be less insightful or may fail to capture important patterns and trends in the data.

Presentation of Findings

The presentation of findings is an integral part of any data analysis project. Students often need to create PPT presentations or submit reports in PDF format to communicate their results effectively. Without access to the right tools or design skills, students may struggle to create professional and visually appealing presentations. Additionally, without access to detailed data visualizations and sophisticated graphs, the impact of their findings may be lessened.

Accuracy and Credibility

Resource constraints can also affect the accuracy and credibility of student data analysis projects. Without access to quality data and the appropriate tools to analyze it, students may make errors in their analysis. These errors can significantly undermine the credibility of the project, especially when students are expected to make data-driven recommendations or conclusions.

Overall Project Scope

Students who face resource constraints may have to narrow the scope of their research question or project objectives to fit within the limitations of the resources they can access. This often means that their projects lack the breadth required to offer in-depth insights. The inability to use multiple datasets or advanced analysis techniques can result in incomplete findings that do not fully address the original research question.

Resource Constraints in Student Data Analysis Projects

Overcoming Resource Constraints in Student Data Analysis Projects

While resource constraints present challenges, there are several strategies that students can use to mitigate their effects and maximize the potential of their data analysis projects.

Use of Open-Source Tools and Software

One of the most effective ways for students to overcome financial constraints is by using free and open-source software for data analysis. Tools like R, Python, and Jupyter Notebooks are widely used in data science and statistical analysis and are freely available. These tools come with a wide array of libraries and packages that make data manipulation, analysis, and visualization more accessible. By using these tools, students can avoid the high costs associated with proprietary software.

Accessing Open-Data Repositories

Students can also leverage open-data repositories such as Kaggle, Google Dataset Search, and the UCI Machine Learning Repository to find publicly available datasets. These platforms offer a wide variety of datasets from different domains, including business, healthcare, and social sciences. By making use of these resources, students can access high-quality data without incurring additional costs.

Cloud-Based Solutions

Cloud-based computing solutions, such as Google Colab, AWS, and Microsoft Azure, provide students with access to powerful computational resources without the need for expensive hardware. These platforms offer free tiers and student discounts that allow students to run complex analyses, such as machine learning models, on powerful virtual machines. Cloud computing also enables collaboration among students, allowing them to share resources and work on projects together.

Time Management and Prioritization

Time management is essential for overcoming time constraints. Students should prioritize tasks and break down their data analysis projects into smaller, manageable steps. By setting realistic goals and sticking to a schedule, students can ensure they allocate enough time to each stage of the project, including data collection, analysis, and presentation.

Seeking Mentorship and Guidance

Students can benefit from seeking mentorship and guidance from professors, peers, or industry professionals. Mentors can provide valuable insights and help students navigate resource constraints more effectively. By leveraging the knowledge and experience of others, students can find creative solutions to overcome challenges and improve the quality of their projects.

Collaboration and Resource Sharing

Collaborating with other students can also help mitigate resource constraints. By pooling resources, students can gain access to more tools, data, and computational power. Additionally, collaborative projects can offer opportunities for skill-sharing, enabling students to learn from one another and strengthen their technical expertise.

Resource Constraints in Student Data Analysis Projects

Conclusion

Resource constraints are a significant challenge for students working on data analysis projects. Financial limitations, technical difficulties, limited access to data, and time constraints can all impact the quality and scope of student research. However, by utilizing open-source tools, accessing public datasets, leveraging cloud-based solutions, managing time effectively, and seeking mentorship, students can overcome these barriers and produce high-quality data analysis projects. As the demand for data-driven insights continues to grow across various fields, it is essential for educational institutions to provide students with the resources and support they need to succeed in data analysis.

By addressing these constraints, students can better equip themselves for the future, where data literacy and analytical skills are increasingly important.

Needs help with similar assignment?

We are available 24x7 to deliver the best services and assignment ready within 3-4 hours? Order a custom-written, plagiarism-free paper

Get Answer Over WhatsApp Order Paper Now