How To Conduct Correlation Analysis and Basic Analysis of Variance in SPSS|2025
/in SPSS Articles /by BesttutorLearn how to conduct correlation analysis and basic analysis of variance in SPSS. Discover the steps to analyze relationships and compare group means effectively.
Statistical analysis is a fundamental part of data analysis in various research fields, including psychology, economics, social sciences, health sciences, and business. One of the most common tools used for statistical analysis is SPSS (Statistical Package for the Social Sciences), which provides a user-friendly interface and powerful functionalities to analyze both qualitative and quantitative data. Among the various statistical methods in SPSS, correlation analysis and analysis of variance (ANOVA) are two commonly used techniques for exploring relationships between variables and comparing group means.
In this paper, we will provide a detailed guide on how to conduct correlation analysis and basic analysis of variance (ANOVA) in SPSS. We will also delve into how to interpret the results, focusing on the Pearson correlation and the ANOVA test. Additionally, we will discuss how these analyses can be used in practical scenarios, along with a focus on SPSS data analysis examples and SPSS analysis interpretation.
Correlation Analysis in SPSS
Understanding Correlation Analysis
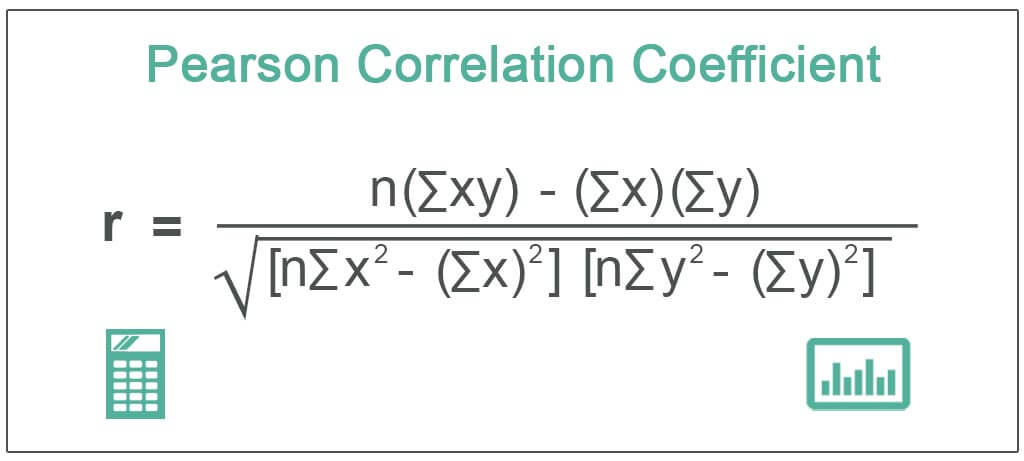
Correlation analysis measures the strength and direction of the relationship between two or more variables. The most common type of correlation used in SPSS is the Pearson correlation which assesses the linear relationship between two continuous variables.
Steps to Conduct Correlation Analysis in SPSS
To perform correlation analysis in SPSS, follow these steps:
- Load the data: Open SPSS and load your dataset by clicking on
File→Open→Data, then select your file. - Navigate to the correlation menu: Once the dataset is loaded, go to the menu bar, click on
Analyze→Correlate→Bivariate. - Select variables: In the
Bivariate Correlationsdialog box, select the variables you want to correlate from the list on the left, and move them to theVariablesbox on the right. - Choose correlation method: Make sure that Pearson is selected under the “Correlation Coefficients” section. You can also choose to include Spearman or Kendall’s tau if the data does not meet the assumptions of normality.
- Run the analysis: Click
OKto run the analysis. SPSS will generate a correlation table in the output window.
How to Interpret Pearson Correlation in SPSS
The output of the correlation analysis will contain a table, which provides Pearson correlation coefficients for the selected pairs of variables. The key elements in the table are:
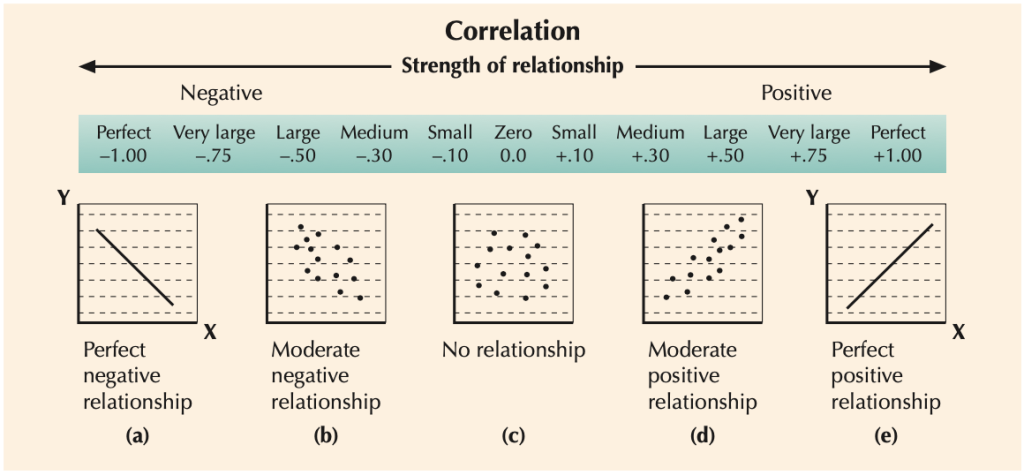
- Pearson Correlation Coefficient (r): This value ranges from -1 to +1, representing the strength and direction of the relationship between the two variables.
- r = 1: Perfect positive correlation
- r = -1: Perfect negative correlation
- r = 0: No correlation
- r > 0: Positive relationship (as one variable increases, the other also increases)
- r < 0: Negative relationship (as one variable increases, the other decreases)
- Sig. (2-tailed): This value represents the p-value for the correlation test. A value less than 0.05 indicates a statistically significant correlation between the variables.
- N: The number of valid cases used in the correlation analysis.
Example Interpretation
If you are analyzing the relationship between hours of study and exam performance (score), and the Pearson correlation coefficient is r = 0.85 with a p-value < 0.01, you can conclude that there is a strong positive relationship between the two variables, and the result is statistically significant.
How to Interpret the Correlation Table in SPSS
The correlation table in SPSS shows the Pearson correlation coefficients for all pairs of selected variables. In the table:
- The diagonal elements represent the correlation of each variable with itself, which is always 1.
- The off-diagonal elements represent the correlation between different variables.
- The significance value helps determine whether the correlation is statistically significant.
A significant correlation (p < 0.05) means that the relationship between the variables is unlikely to be due to random chance.
Analysis of Variance (ANOVA) in SPSS
Understanding Analysis of Variance (ANOVA)
ANOVA (Analysis of Variance) is a statistical method used to compare the means of three or more groups to determine whether there is a statistically significant difference among them. The primary assumption of ANOVA is that the data is normally distributed and that there is homogeneity of variances across groups.
Steps to Conduct Basic ANOVA in SPSS
Follow these steps to perform a one-way ANOVA in SPSS:
- Load the data: As with correlation analysis, start by opening your dataset in SPSS.
- Navigate to the ANOVA menu: Click on
Analyze→Compare Means→One-Way ANOVA. - Select the dependent and independent variables: In the dialog box, move the dependent variable (the outcome you want to measure) to the
Dependent Listbox, and the independent variable (the grouping factor) to theFactorbox. - Set options: Click
Optionsto select additional statistics, such as descriptive statistics and homogeneity tests (Levene’s test). - Run the analysis: Click
OKto perform the ANOVA.
How to Interpret ANOVA Results in SPSS
The output from the one-way ANOVA will include the following key components:
- Descriptive Statistics: This section provides the mean, standard deviation, and count for each group.
- ANOVA Table: The key part of the output:
- Between-Groups Sum of Squares (SSB): The variance due to the interaction between the groups.
- Within-Groups Sum of Squares (SSW): The variance within the groups.
- F-statistic: The ratio of between-group variance to within-group variance. A higher value suggests greater differences between the groups.
- Sig. (p-value): A p-value less than 0.05 indicates that at least one group mean is significantly different from the others.
Example Interpretation
If the F-statistic is 4.25 and the p-value is 0.02, this suggests that there is a statistically significant difference between at least two of the group means. To identify which groups are different, post-hoc tests (e.g., Tukey’s HSD) can be conducted.
How to Interpret the ANOVA Table in SPSS
In the ANOVA table, focus on:
- F-value: If this is large and the p-value is small (typically < 0.05), you can conclude that there are significant differences between the groups.
- Post-hoc tests: If the ANOVA is significant, post-hoc tests help identify which specific groups differ from one another.
:max_bytes(150000):strip_icc()/Correlation_Coefficient-168d916406e24a21b08e18f837fe416a.png)
SPSS Data Analysis Examples
SPSS Data Analysis for Quantitative Data
Quantitative data analysis often involves analyzing relationships between variables, testing hypotheses, and examining differences among groups. SPSS is widely used for quantitative data analysis due to its accessibility and powerful features. Some common analysis methods include:
- Descriptive statistics: To summarize the central tendency, spread, and distribution of data.
- Regression analysis: To model the relationship between dependent and independent variables.
- Factor analysis: To identify underlying relationships among variables.
SPSS Data Analysis Examples PDF
SPSS also provides users with SPSS analysis examples PDFs that offer step-by-step guides on how to analyze specific data types. These include tutorials for analyzing survey data, customer satisfaction, clinical trials, and more.
SPSS Analysis for Questionnaire Data
When working with questionnaire data, SPSS is an excellent tool for analyzing responses, particularly when responses are on Likert scales. Common analyses include:
- Descriptive analysis to understand frequencies and central tendencies.
- Reliability analysis (Cronbach’s alpha) to measure the internal consistency of questionnaire items.
- Factor analysis to reduce the number of variables and identify underlying constructs.
For SPSS analysis for questionnaires, it is important to understand how to interpret the responses in the context of the research question.
SPSS Analysis Interpretation PDFs and Free Downloads
Many resources are available for learning how to interpret SPSS analysis, such as SPSS analysis interpretation PDF files and SPSS data analysis examples PDF free downloads. These resources are useful for beginners and experienced analysts alike.

Conclusion
In this paper, we explored how to conduct correlation analysis and basic analysis of variance (ANOVA) in SPSS. We highlighted the steps involved in performing these analyses, and provided insights into how to interpret the results. By using tools like Pearson correlation and ANOVA, researchers can better understand relationships between variables and differences between group means. SPSS remains an invaluable tool for both novice and experienced researchers in conducting quantitative data analysis, and the SPSS analysis examples and guides available in PDF form are excellent resources to help users improve their skills.
Needs help with similar assignment?
We are available 24x7 to deliver the best services and assignment ready within 3-4 hours? Order a custom-written, plagiarism-free paper