How to Analyze Complex Datasets with SPSS|2025
Statistical analysis plays a crucial role in extracting meaningful insights from complex datasets. One of the most widely used tools for data analysis is SPSS (Statistical Package for the Social Sciences). SPSS is a powerful software suite that allows researchers, analysts, and students to perform a wide range of statistical tests and data manipulations. This paper will delve into how to analyze complex datasets using SPSS, focusing on various aspects such as demographic analysis, handling yes/no questionnaire data, and statistical analysis in SPSS version 24.
We will also explore useful resources like “How to Use SPSS®: A Step-by-Step Guide to Analysis and Interpretation PDF” and provide a comprehensive guide on running statistical analyses and using SPSS for survey data analysis. Understanding these procedures will equip researchers with the knowledge to confidently handle and analyze complex datasets with SPSS.
The Basics of SPSS
Before diving into complex data analysis, it is important to understand the basic interface and functionalities of SPSS. SPSS is designed with an intuitive user interface consisting of multiple windows. These include:
- Data View: This is where datasets are loaded and viewed in a spreadsheet-like format. Each row corresponds to a case, while each column represents a variable.
- Variable View: Here, the characteristics of each variable (such as name, type, labels, and value codes) can be adjusted.
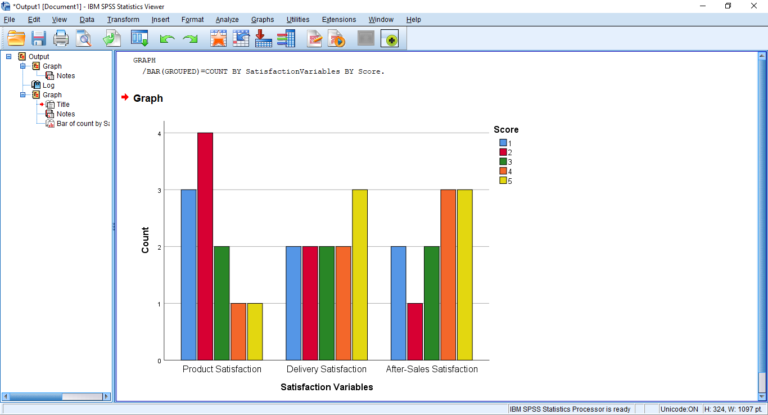
- Output View: This is where the results of your analyses are displayed after running commands.
How to Import Data into SPSS
One of the first steps in using SPSS for data analysis is importing the dataset. SPSS supports multiple data formats, including .sav (native SPSS format), .xls/.xlsx (Excel), .csv (comma-separated values), and more. To import data, go to File > Open > Data and choose the format of your dataset.
If your data is stored in an Excel file, for example, select the Excel format, and the Import Wizard will guide you through the process of selecting your sheet, variables, and how they should be interpreted by SPSS.
How to Analyze Complex Datasets Using SPSS
Now that we’ve covered the basics, let’s move on to how to analyze complex datasets using SPSS. Complex datasets often include multiple variables, multiple response categories, and non-normally distributed data. SPSS offers a wide range of analysis tools to accommodate different types of data and research objectives.
Descriptive Statistics
Descriptive statistics are essential for summarizing and understanding the features of a dataset. In SPSS, the Descriptive Statistics option under the Analyze menu allows you to compute measures such as mean, median, mode, standard deviation, and frequency distributions.
To compute descriptive statistics:
- Go to Analyze > Descriptive Statistics > Descriptives.
- Select the variables you want to analyze.
- Choose additional statistics options (such as mean, median, etc.), and then click OK.
For categorical variables, frequency tables provide a count of the occurrences of each category. To generate a frequency table:
- Go to Analyze > Descriptive Statistics > Frequencies.
- Select the variables and check the options for percent distributions.
Demographic Analysis
Demographic analysis involves exploring the characteristics of your sample, such as age, gender, income, or other personal attributes. SPSS is particularly useful for demographic analysis because it allows researchers to categorize and summarize data efficiently.
For demographic analysis:
- Frequencies: As mentioned, frequency tables provide a simple way to summarize the number of occurrences for each category (e.g., gender, race).
- Crosstabulation: SPSS also allows you to explore relationships between two or more categorical variables using crosstabulation. Go to Analyze > Descriptive Statistics > Crosstabs, and select the variables you want to analyze.
- Descriptive Statistics for Demographics: Demographic data is typically summarized through measures such as age groups, income brackets, or educational levels. You can also use Means and Standard Deviations to explore numerical demographic characteristics.

How to Analyze Yes/No Questionnaire Data Using SPSS
Yes/No data, often referred to as binary data, are frequently used in questionnaires. Analyzing such data requires specific techniques to examine relationships and trends.
SPSS offers tools such as Crosstabs and Chi-Square Tests for analyzing binary data:
- Crosstabs: This can be used to explore relationships between yes/no variables and other categorical or continuous variables.
- Chi-Square Test: A Chi-Square test is often used to assess if there is a significant association between two categorical variables. To run a Chi-Square test:
- Go to Analyze > Descriptive Statistics > Crosstabs.
- Select your yes/no variables and check the option for Chi-Square under Statistics.
For a simple breakdown of yes/no data, you can use Frequencies to get a quick summary of how many responses were “Yes” versus “No.”
Running Statistical Analysis in SPSS
When analyzing complex datasets, statistical analysis is essential for drawing conclusions and making data-driven decisions. SPSS offers a variety of statistical tests, including t-tests, ANOVAs, regression analysis, and more.
- T-tests: Used to compare the means of two groups. To perform a t-test:
- Go to Analyze > Compare Means > Independent-Samples T Test (for two independent groups) or Paired-Samples T Test (for related samples).
- ANOVA (Analysis of Variance): Used to compare the means of three or more groups. Go to Analyze > Compare Means > One-Way ANOVA.
- Regression Analysis: SPSS allows for linear and logistic regression. For linear regression:
- Go to Analyze > Regression > Linear.
Running these statistical tests will provide you with valuable outputs, including test statistics, p-values, and confidence intervals, which will help in understanding the relationships in your data.
Advanced Statistical Analysis with SPSS Version 24
SPSS version 24 introduces several improvements and features that are useful for advanced statistical analysis. One such feature is the General Linear Model (GLM), which allows you to perform more complex analyses such as repeated measures and multivariate analysis.
- Repeated Measures: This allows you to analyze data collected from the same subjects over time or under different conditions.
- Multivariate Analysis: SPSS also supports multivariate techniques such as MANOVA and factor analysis.
Other important features include data transformation tools (for creating new variables), the ability to handle missing data, and advanced visualization options like histograms, box plots, and scatterplots for better data interpretation.
Using SPSS for Survey Data Analysis
Survey data often involves multiple responses from many participants across various variables. SPSS is ideal for handling large datasets, cleaning data, and analyzing survey responses. Key steps in analyzing survey data in SPSS include:
- Data Cleaning: Before conducting any analysis, ensure that the data is cleaned. This includes checking for missing data, correcting errors, and handling outliers.
- Data Transformation: Use SPSS’s Transform menu to create new variables, recode existing variables, or compute summary scores for survey scales.
- Factor Analysis: This technique is useful for identifying underlying factors in a set of survey questions. You can perform factor analysis by going to Analyze > Dimension Reduction > Factor.
- Reliability Analysis: For surveys with multiple items measuring the same construct, conducting a Cronbach’s Alpha reliability test is crucial. Go to Analyze > Scale > Reliability Analysis.
Finally, once your survey data is analyzed, SPSS can generate graphs, tables, and reports, which can be used to present findings in a clear and structured manner.
Conclusion
SPSS is a robust tool for analyzing complex datasets, from basic descriptive statistics to advanced statistical modeling. By utilizing various functions such as demographic analysis, crosstabulation, t-tests, ANOVA, and regression analysis, users can draw valuable insights from their data. Additionally, with the features introduced in SPSS version 24, researchers can perform even more sophisticated analyses. Whether you’re analyzing yes/no data, survey responses, or conducting in-depth multivariate studies, SPSS is a powerful tool that streamlines the analytical process.
For further learning, resources like “How to Use SPSS®: A Step-by-Step Guide to Analysis and Interpretation PDF” and “How to Analyze Complex Datasets with SPSS PDF” provide in-depth explanations and examples, helping users to navigate the software and its capabilities. With this knowledge, anyone can become proficient in analyzing complex datasets and extracting valuable insights using SPSS.
Needs help with similar assignment?
We are available 24x7 to deliver the best services and assignment ready within 3-4 hours? Order a custom-written, plagiarism-free paper


.png)